Full Report
The numbers behind Charter Communications, Inc.: as-reported financial statements and company metrics for FY2021–FY2025, traced to the source filings, opened with the share-price history those statements have to justify. Every linked figure opens the exact page of the filing it was printed on, with the statement row highlighted. Amounts in US$ millions unless noted.
Reading notes: Display units are as printed by Charter: 'dollars in millions, except per share and share data'. Per-share figures and share counts are as printed. FY2021-FY2025 income statement, balance sheet and cash-flow figures are each taken from that fiscal year's own Form 10-K (as originally reported), current-year column. Revenue by product line: FY2023-FY2025 come from the FY2025 Form 10-K revenue footnote (Note 14, p.168); FY2021 and FY2022 come from the FY2023 Form 10-K footnote (Note 12, p.147), the oldest filing in the corpus that presents them on the current basis with mobile service inside residential revenue. The FY2022 Form 10-K's own presentation showed Mobile as a separate line below commercial revenue (residential revenue of 41,241 for 2022) and is not comparable to the later years. The FY2025 Form 10-K renamed two commercial lines: 'Small and medium business' became 'Small business' and 'Enterprise' became 'Mid-market large business'. The tab uses the current labels for the whole series (the ampersand spelled out as 'and'); the FY2021 and FY2022 citations quote the older printed labels.
Share Price — Full Available History — 17 Years
The stock closed at $129.22 on Jul 22, 2026 — up 269% over the window shown (+8.2% a year), trading between $29.50 and $821.01. At that close the stock trades at 3.6× FY2025 diluted EPS as reported below.
Source: market price feed, monthly closes, sampled from 4,162 source observations, Jan 2010–Jul 2026. Price return only, excludes dividends.
Market capitalization $30.3bn and enterprise value $124.6bn.
Market cap = 234.8M shares outstanding × the Jul 22, 2026 close of $129.22. Enterprise value adds total debt of $94.8bn and subtracts cash and equivalents of $477mn (net debt of $94.3bn), from the FY2025 balance sheet. Market-derived figures, shown without filing links.
FY2025 at a Glance
Revenue (US$ millions)
Net income (US$ millions)
Diluted EPS
Source: FY2025 consolidated statements [1] [2] [3] [4]. Click any linked figure to open the filing page with the row highlighted.
Revenue by Product Line
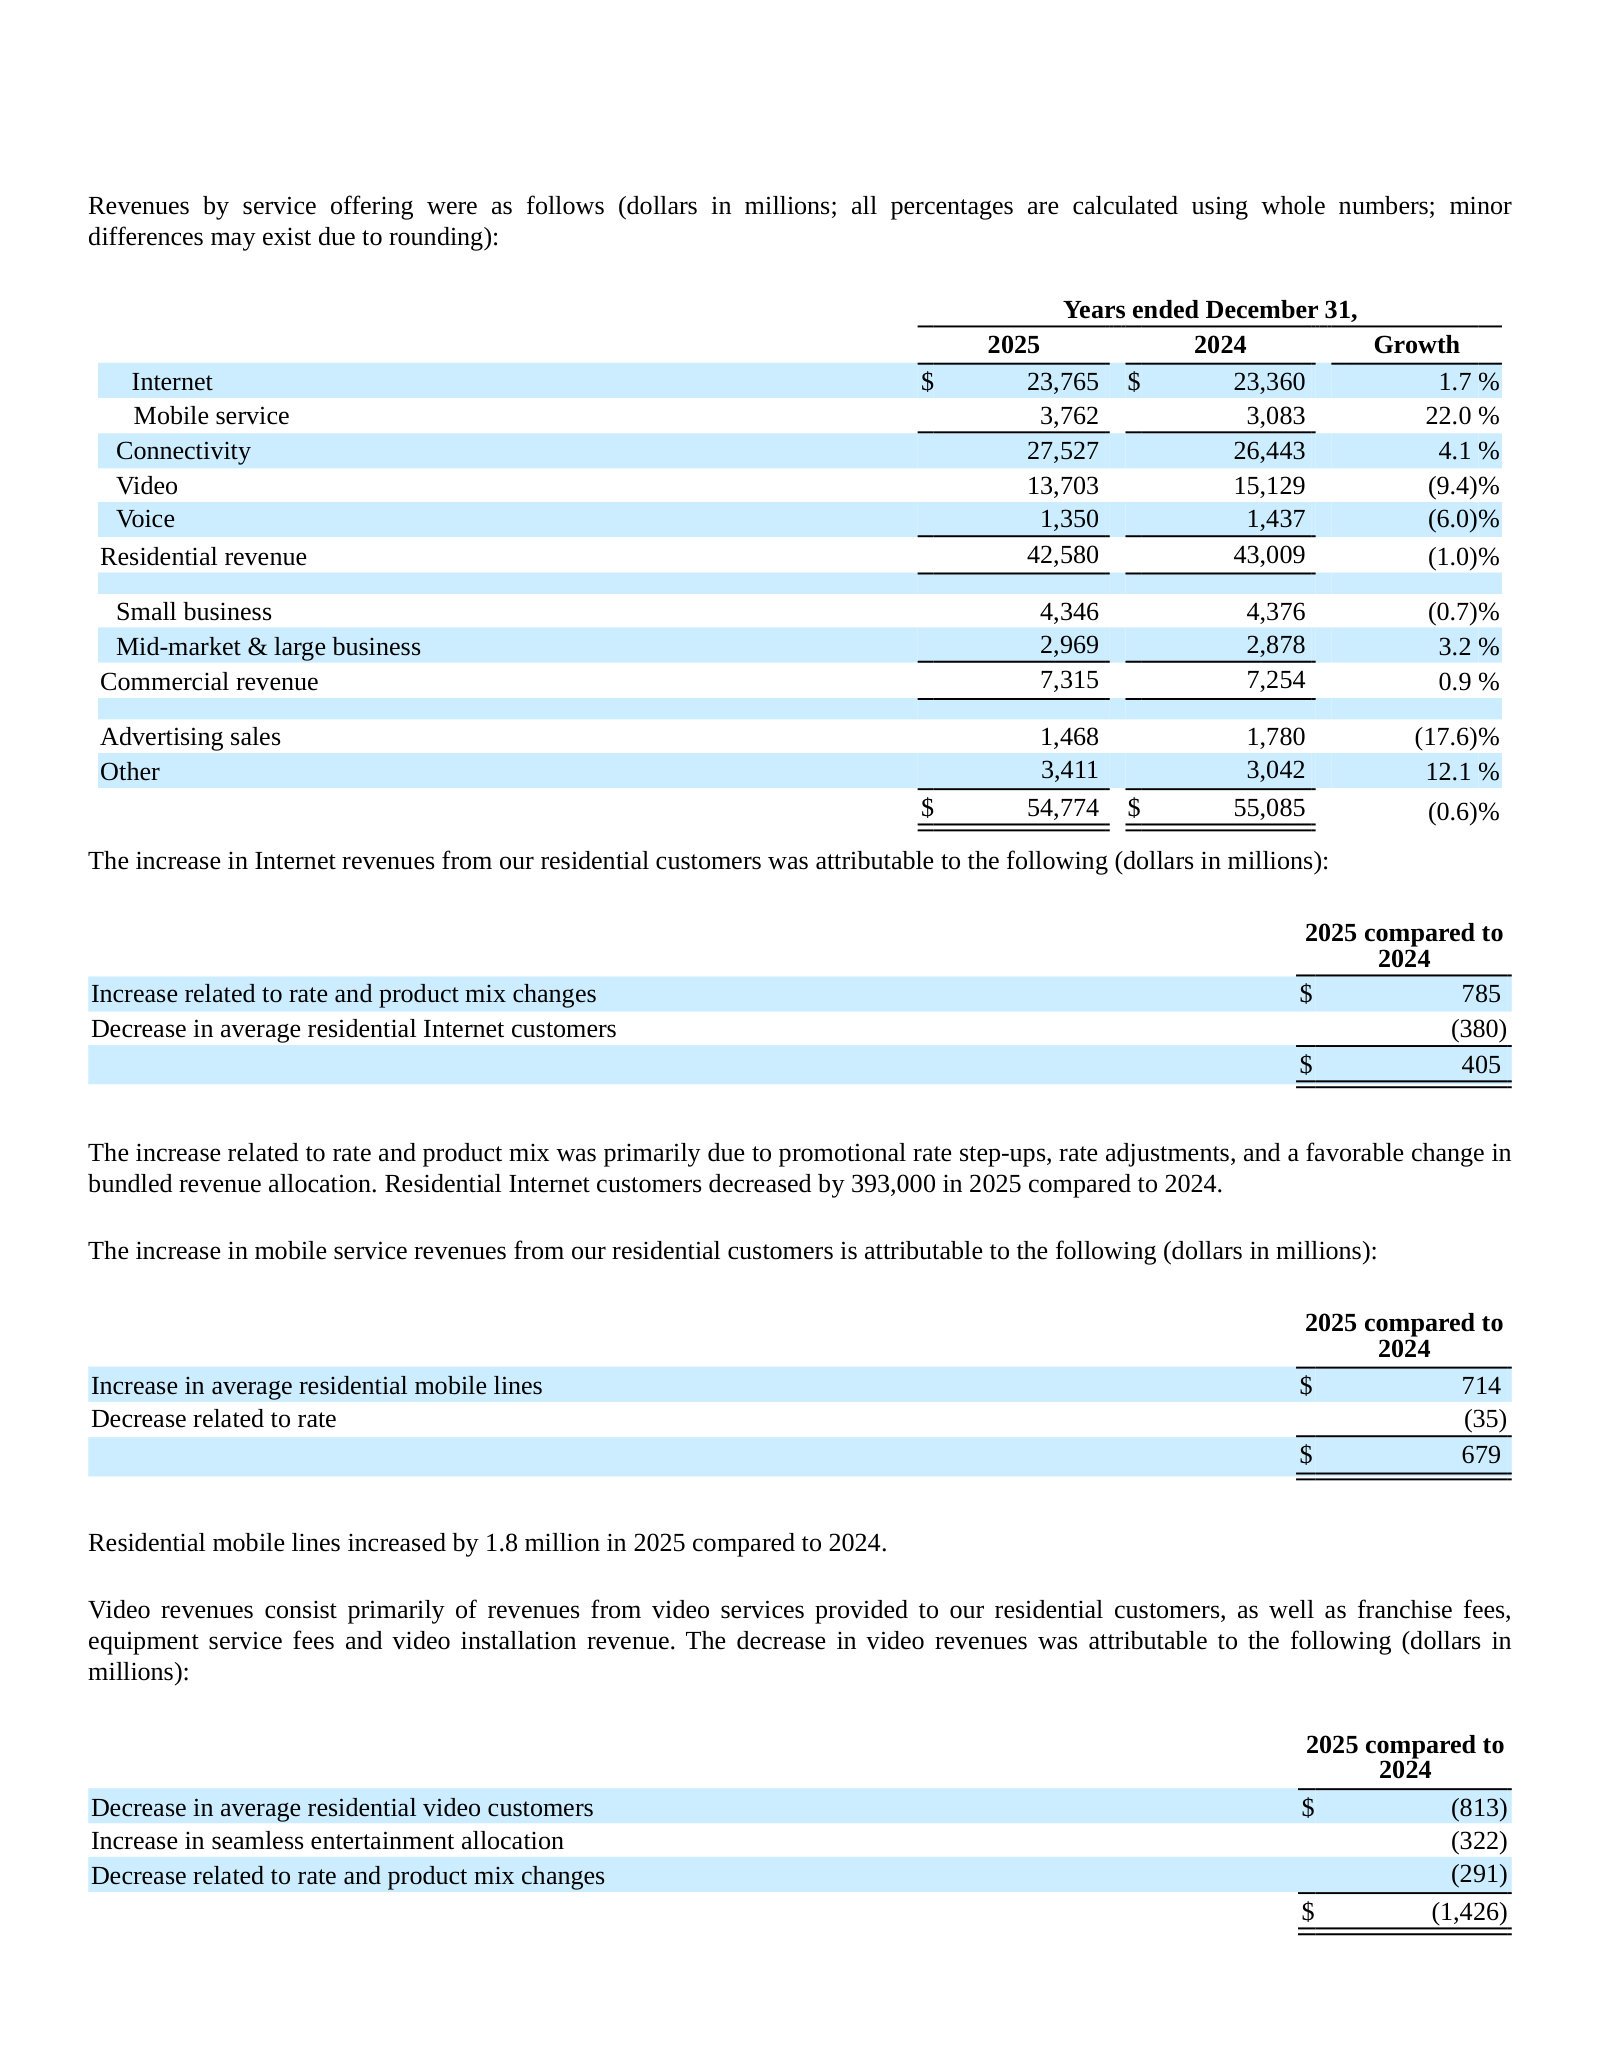
| Revenue by Product Line | FY2021 | FY2022 | FY2023 | FY2024 | FY2025 |
|---|---|---|---|---|---|
| Internet | 21,094 | 22,222 | 23,032 | 23,360 | 23,765 |
| Mobile service | 1,239 | 1,698 | 2,243 | 3,083 | 3,762 |
| Video | 17,630 | 17,460 | 16,353 | 15,129 | 13,703 |
| Voice | 1,598 | 1,559 | 1,510 | 1,437 | 1,350 |
| Residential revenue | 41,561 | 42,939 | 43,138 | 43,009 | 42,580 |
| Small business | 4,198 | 4,350 | 4,355 | 4,376 | 4,346 |
| Mid-market and large business | 2,573 | 2,677 | 2,767 | 2,878 | 2,969 |
| Commercial revenue | 6,771 | 7,027 | 7,122 | 7,254 | 7,315 |
| Advertising sales | 1,594 | 1,882 | 1,551 | 1,780 | 1,468 |
| Other | 1,756 | 2,174 | 2,796 | 3,042 | 3,411 |
| Total revenues | 51,682 | 54,022 | 54,607 | 55,085 | 54,774 |
| Total revenues growth, derived | — | +4.5% | +1.1% | +0.9% | -0.6% |
Source: Form 10-K revenue footnote (revenues by product line); total revenues from the Consolidated Statements of Operations. FY2021-FY2022 are taken from the FY2023 Form 10-K, the oldest filing that presents them on the current basis (mobile service inside residential revenue). [5] [1] [2] [6]. Click any linked figure to open the filing page with the row highlighted.
Income Statement
Source: Consolidated Statements of Operations, each year from its own Form 10-K [1] [2] [3] [4]. Click any linked figure to open the filing page with the row highlighted.
Columns marked E are consensus analyst estimates from S&P Capital IQ (CapIQ), shown alongside reported results for direct comparison; they are not company guidance.
Estimate source: S&P Capital IQ (CapIQ) consensus, as of 2026-08-01. Estimate figures are S&P Capital IQ consensus (vendor data — no filing page links). EPS and net income use the normalized (adjusted) consensus where the street reports it. Line-item analyst models (segments, drivers, KPIs) are in the Visible Alpha tab.
Balance Sheet
Source: Consolidated Balance Sheets, each year from its own Form 10-K [7] [8] [9] [10]. Click any linked figure to open the filing page with the row highlighted.
Cash Flow
Source: Consolidated Statements of Cash Flows, each year from its own Form 10-K [11] [12] [13] [14]. Click any linked figure to open the filing page with the row highlighted.
Operating Statistics — Customers ARPU
| Operating Statistics — Customers ARPU | FY2021 | FY2022 | FY2023 | FY2024 | FY2025 |
|---|---|---|---|---|---|
| Total Internet customers (000s) | 30,089 | 30,433 | 30,588 | 30,080 | 29,680 |
| Total Video customers (000s) | 15,833 | 15,147 | 14,122 | 12,892 | 12,605 |
| Total Voice customers (000s) | 9,903 | 8,983 | 8,005 | 6,884 | 6,046 |
| Total Mobile lines (000s) | 3,564 | 5,292 | 7,766 | 9,883 | 11,766 |
| Monthly residential revenue per residential customer ($/mo) | 113.61 | 114.66 | 119.89 | 121.04 | 119.05 |
| Monthly small business revenue per SMB customer ($/mo) | 165.50 | 164.50 | 163.64 | 164.08 | 161.50 |
Source: company filings [15] [16] [17] [18]. Click any linked figure to open the filing page with the row highlighted.
Adjusted EBITDA, Free Cash Flow Leverage
| Adjusted EBITDA, Free Cash Flow Leverage | FY2021 | FY2022 | FY2023 | FY2024 | FY2025 |
|---|---|---|---|---|---|
| Adjusted EBITDA | 20,630 | 21,616 | 21,894 | 22,569 | 22,708 |
| Free cash flow | 8,684 | 6,102 | 3,490 | 4,257 | 5,004 |
| Cash paid for interest | 4,043 | 4,509 | 5,020 | 5,334 | 4,983 |
| Leverage ratio (net debt / LTM Adjusted EBITDA) | 4.4 | 4.5 | 4.4 | 4.1 | 4.2 |
Source: company filings [11] [19] [20] [12]. Click any linked figure to open the filing page with the row highlighted.
Capital Expenditures by Category
| Capital Expenditures by Category | FY2021 | FY2022 | FY2023 | FY2024 | FY2025 |
|---|---|---|---|---|---|
| Customer premise equipment | 1,967 | 2,209 | 2,286 | 2,172 | 2,260 |
| Scalable infrastructure | 1,677 | 1,791 | 1,368 | 1,422 | 1,536 |
| Upgrade/rebuild | 706 | 845 | 1,719 | 1,771 | 1,937 |
| Support capital | 1,643 | 1,541 | 1,727 | 1,688 | 1,986 |
| Line extensions | 1,642 | 2,990 | 4,015 | 4,216 | 3,940 |
| Total capital expenditures | 7,635 | 9,376 | 11,115 | 11,269 | 11,659 |
Source: company filings [21] [22] [23] [24]. Click any linked figure to open the filing page with the row highlighted.
Long-Term Record
| Fiscal year | Total revenues | Income from operations | Net income attributable to Charter shareholders | Diluted earnings per common share | Net cash flows from operating activities | Purchases of property, plant and equipment |
|---|---|---|---|---|---|---|
| FY2016 | 29,003 | 2,456 | 3,522 | 15.94 | 8,041 | (5,325) |
| FY2017 | 41,581 | 4,106 | 9,895 | 34.09 | 11,954 | (8,681) |
| FY2018 | 43,634 | 5,221 | 1,230 | 5.22 | 11,767 | (9,125) |
| FY2019 | 45,764 | 6,511 | 1,668 | 7.45 | 11,748 | (7,195) |
| FY2020 | 48,097 | 8,405 | 3,222 | 15.40 | 14,562 | (7,415) |
| FY2021 | 51,682 | 10,526 | 4,654 | 24.47 | 16,239 | (7,635) |
| FY2022 | 54,022 | 11,962 | 5,055 | 30.74 | 14,925 | (9,376) |
| FY2023 | 54,607 | 12,559 | 4,557 | 29.99 | 14,433 | (11,115) |
| FY2024 | 55,085 | 13,118 | 5,083 | 34.97 | 14,430 | (11,269) |
| FY2025 | 54,774 | 12,908 | 4,987 | 36.21 | 16,077 | (11,659) |
Source: consolidated statements across filings; older years from the standardized feed [11] [1] [12] [2]. Click any linked figure to open the filing page with the row highlighted.
Operating KPIs
| KPI | FY2021 | FY2022 | FY2023 | FY2024 | FY2025 |
|---|---|---|---|---|---|
| Total customer relationships | 32,069,000 | 32,195,000 | 32,126,000 | 31,473,000 | 31,846,000 |
| Total Internet customers | 30,089,000 | 30,433,000 | 30,588,000 | 30,080,000 | 29,680,000 |
| Total mobile lines | 3,564,000 | 5,292,000 | 7,766,000 | 9,883,000 | 11,766,000 |
| Total video customers | 15,833,000 | 15,147,000 | 14,122,000 | 12,892,000 | 12,605,000 |
| Total voice customers | 9,903,000 | 8,983,000 | 8,005,000 | 6,884,000 | 6,046,000 |
Source: company-reported operating metrics [15] [16] [17] [18]. Click any linked figure to open the filing page with the row highlighted.
Analyst Consensus
Mean target
Median target
High target
Low target
Street ratings: 5 strong buy, 11 hold, 2 sell, 3 strong sell. Consensus: Hold.
Estimate source: S&P Capital IQ (CapIQ) consensus, as of 2026-08-01. Estimate figures are S&P Capital IQ consensus (vendor data — no filing page links). EPS and net income use the normalized (adjusted) consensus where the street reports it. Line-item analyst models (segments, drivers, KPIs) are in the Visible Alpha tab.
Traceability
574 of 592 figures on this page (97%) link to the filing page where they are printed — click a linked figure to open the source PDF at that page with the row highlighted. Unlinked figures come from standardized data feeds or pre-filing years.
Display units are as printed by Charter: 'dollars in millions, except per share and share data'. Per-share figures and share counts are as printed.
FY2021-FY2025 income statement, balance sheet and cash-flow figures are each taken from that fiscal year's own Form 10-K (as originally reported), current-year column.
Revenue by product line: FY2023-FY2025 come from the FY2025 Form 10-K revenue footnote (Note 14, p.168); FY2021 and FY2022 come from the FY2023 Form 10-K footnote (Note 12, p.147), the oldest filing in the corpus that presents them on the current basis with mobile service inside residential revenue. The FY2022 Form 10-K's own presentation showed Mobile as a separate line below commercial revenue (residential revenue of 41,241 for 2022) and is not comparable to the later years.
The FY2025 Form 10-K renamed two commercial lines: 'Small and medium business' became 'Small business' and 'Enterprise' became 'Mid-market large business'. The tab uses the current labels for the whole series (the ampersand spelled out as 'and'); the FY2021 and FY2022 citations quote the older printed labels.
The FY2025 Form 10-K also adds a 'Connectivity' subtotal (Internet plus mobile service) that earlier filings do not print. It is omitted here to keep one consistent set of components across all five years; Internet and Mobile service are shown separately.
Charter reports one reportable segment (FY2025 Form 10-K, Note 13), so revenue by product line is the company's only reported revenue cut and there is no separate segment-profit statement.
Charter's income statement carries two net income lines: 'Consolidated net income' includes Advance/Newhouse Partnership's noncontrolling interest in Charter Communications Holdings, LLC, while 'Net income attributable to Charter shareholders' is the per-share basis. Both are shown.
The balance sheet likewise separates 'Total Charter shareholders' equity' (16,054 at December 31, 2025) from 'Total shareholders' equity' (20,519, including 4,465 of noncontrolling interests). The standardized data feed's shareholders_equity field corresponds to the former.
Long-term record: FY2019 and FY2020 are the comparative columns of the FY2021 Form 10-K and are page-linked. FY2016-FY2018 come from the standardized SEC XBRL data feed and are shown without page links - the corpus contains no filing older than the FY2021 Form 10-K.
FY2016 reflects only a partial year of the Time Warner Cable and Bright House Networks acquisitions (closed May 2016), so the FY2016 to FY2017 step-up in the long-term record is not organic growth.
Quarterly block: every figure is a three-month column printed in Charter's quarterly earnings release (Form 8-K, Exhibit 99.1 addendum), including both Q4 periods - Charter prints a three-month cash-flow statement each quarter, so no quarter is derived from year-to-date differencing.
Cross-check: every mapped annual line (FY2021-FY2025) and every quarterly line available in data/financials/*_quarterly.json (Q1-Q3 FY2025 and Q1 FY2026; the feed carries no Q4 periods) agrees with the filings exactly. No feed-versus-filing conflicts were found; the entries in 'discrepancies' are cross-vintage restatements between Charter's own filings.
5 figure(s) differed between the data feed and the filing; the filing value is shown (see the run's metrics/metrics_tab.json for the audit trail).
Charter Communications, Inc.'s management explains the business in its own materials. The slides below do the most of that work, pulled from the documents preserved in Sources. Each source link opens the complete presentation at that slide in a new tab.
Annual Report on Form 10-K — FY2025 — FY2025
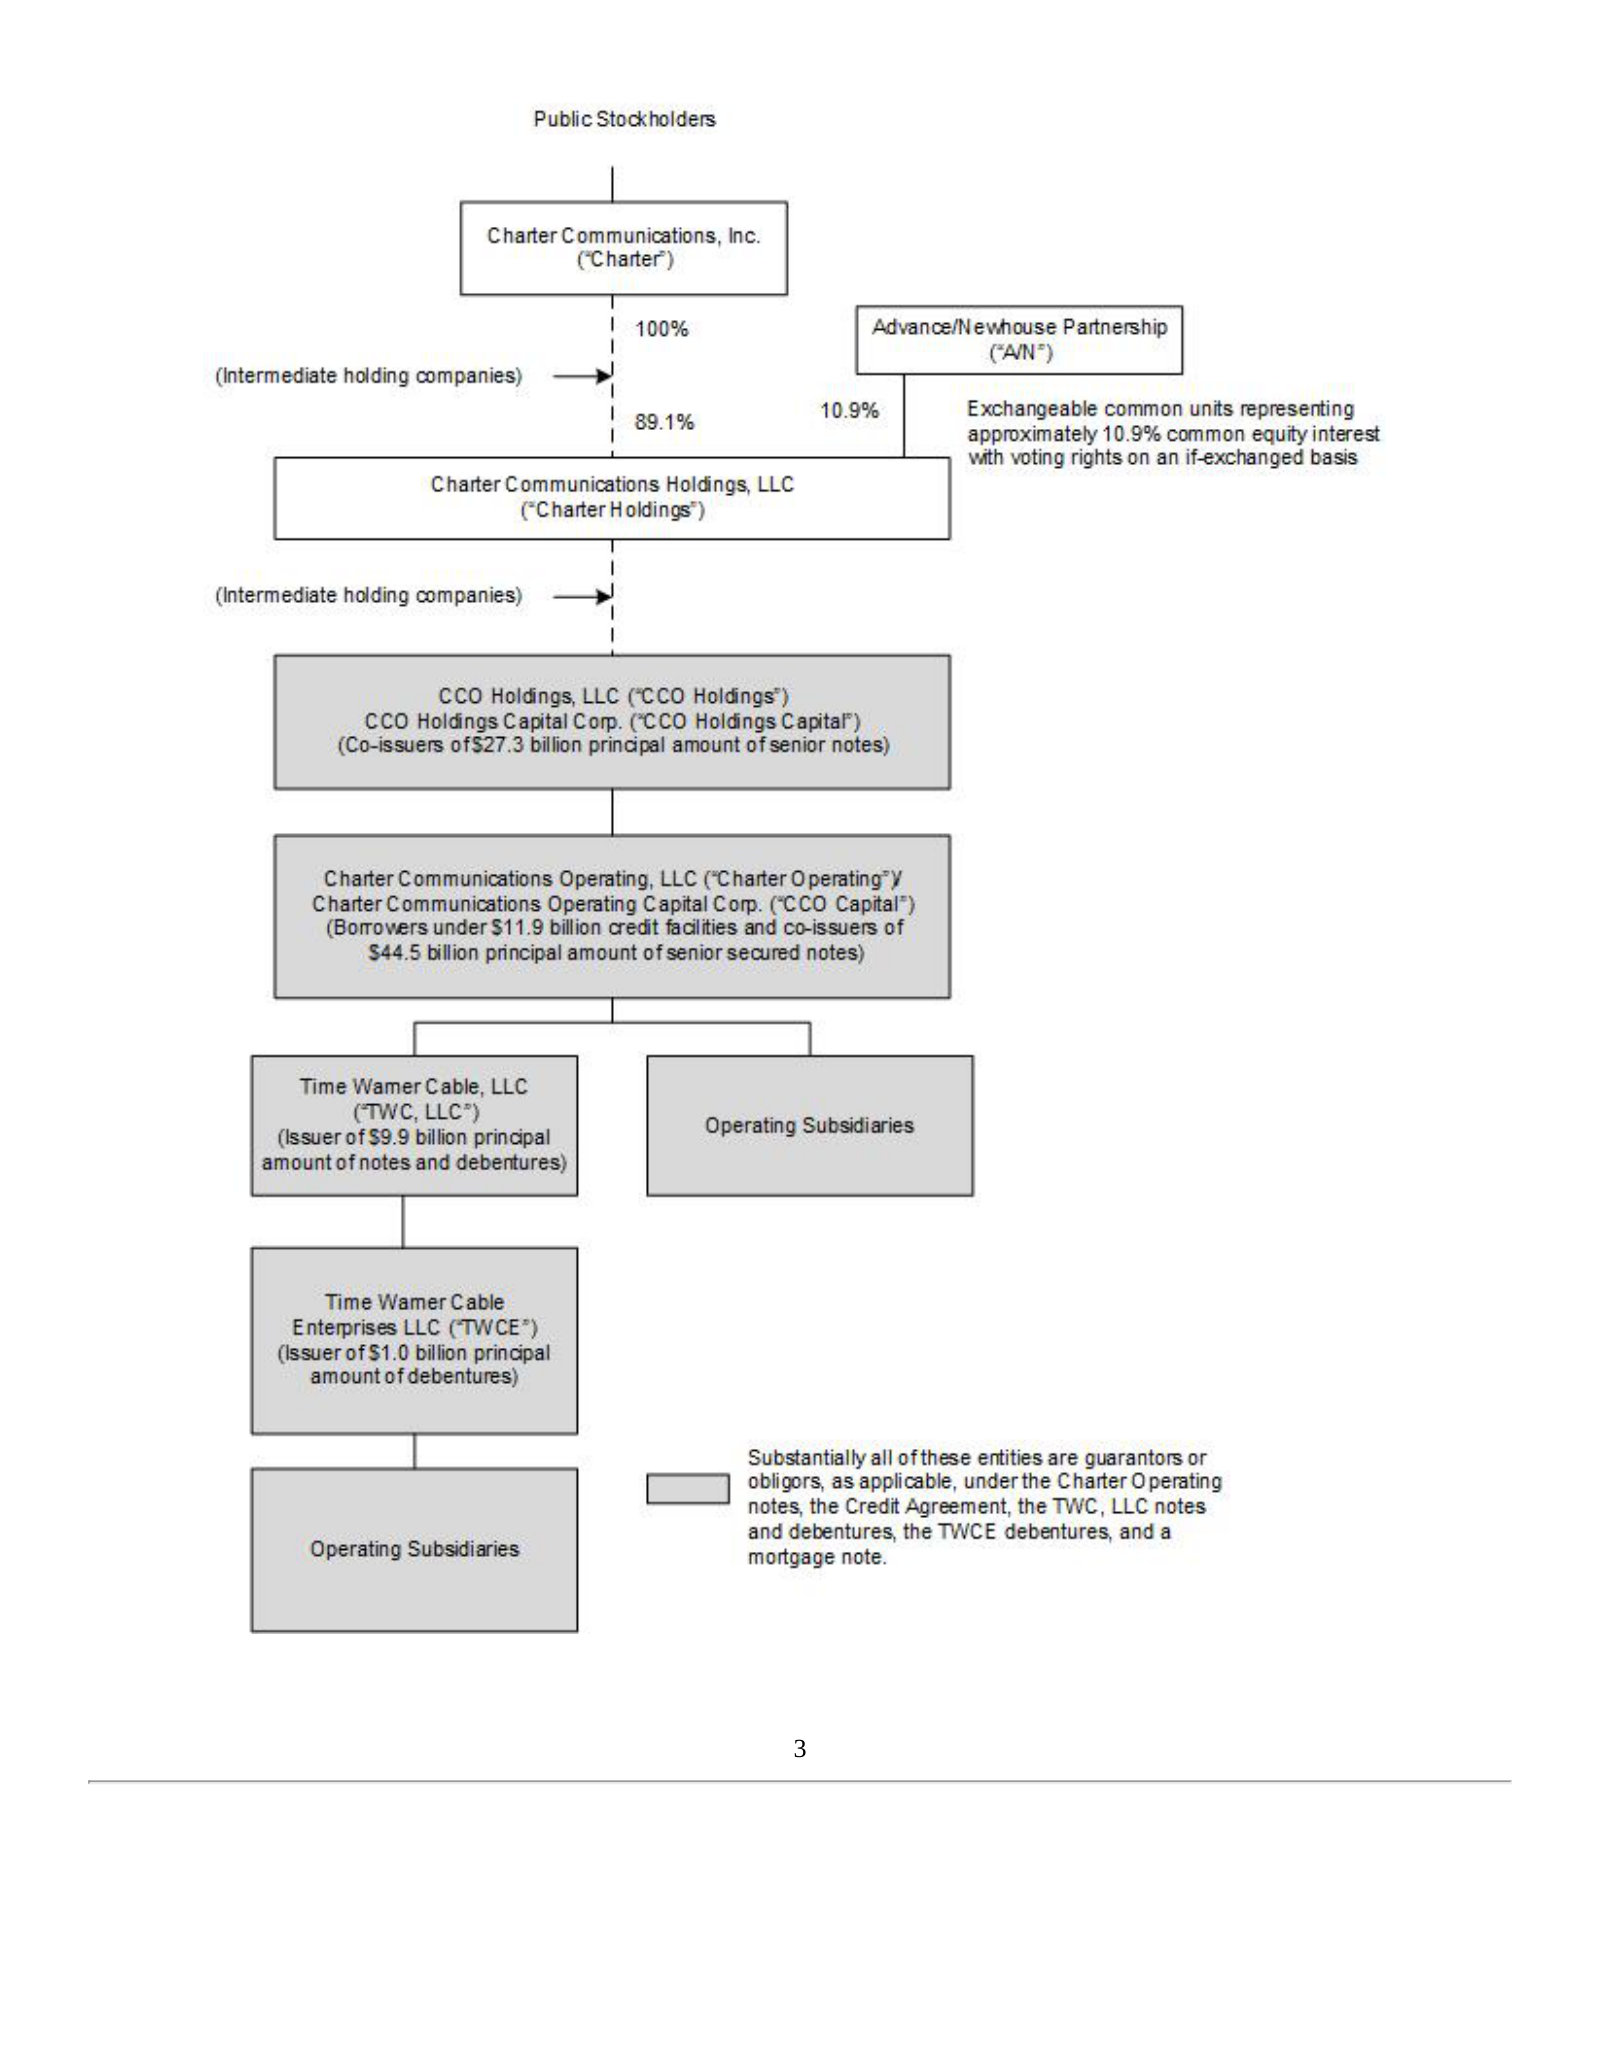
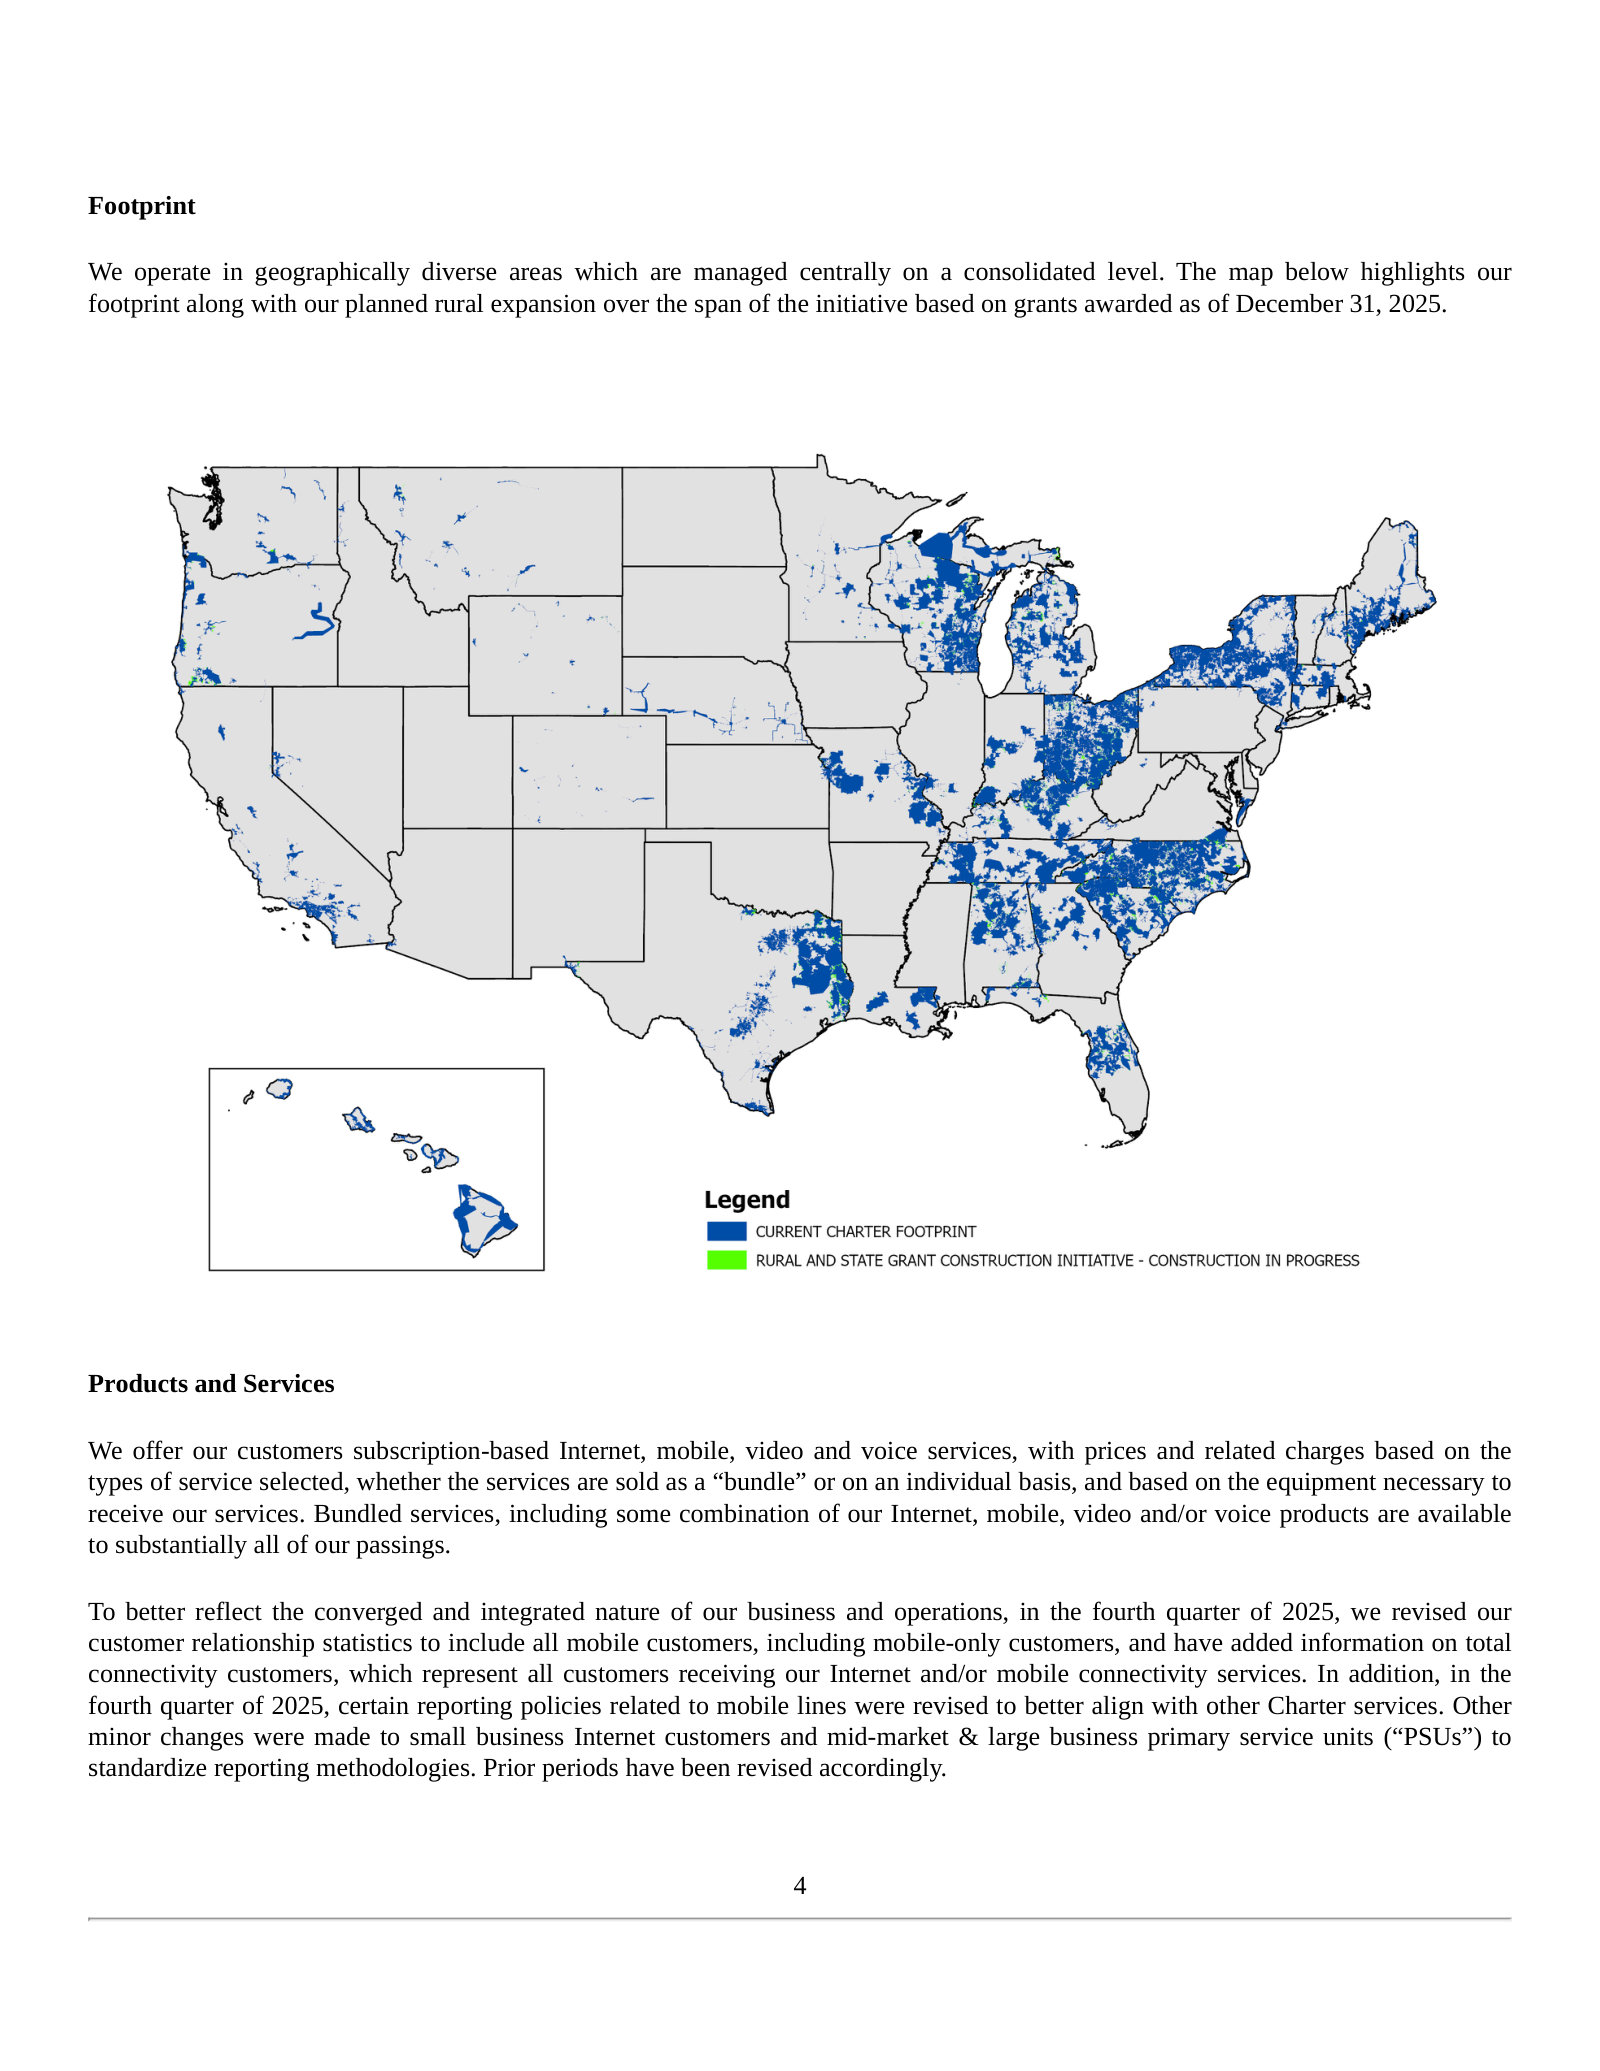
Charter publishes no investor deck. These two exhibits from the FY2025 10-K are the only purpose-built visuals management produces. · Open the full document →
Charter Communications, Inc.'s management answers for the business every quarter. These are the exchanges that explain it best — verbatim, from the call transcripts preserved in Sources. Each link opens the full transcript at that page in a new tab.
Q1 2026 Investor Call — Q1 2026
The current state of the business in management's own words: the operating strategy restated, the capex-to-free-cash-flow bridge quantified, and a candid diagnosis of why broadband is still shrinking. · Open the full transcript →
The operating strategy in one paragraph, and the customer count it has compounded since 2013.
Chris Winfrey (President and CEO): Our core operating strategy remains unchanged: offering great products at the best value with continuously improving service, and that service is uniquely delivered by our 100% U.S.-based employees, 24/7, with the customer commitment supported by money-back guarantees. That core operating strategy has served us well. It fueled our organic and inorganic growth from Legacy Charter in 2013, with just 5 million customer relationships, to Charter today with nearly 32 million customers. And now pro forma for the Cox transaction with over 70 million passings.
p. 2 · Read in context →
The whole bull case arithmetic: capex falling from $11.7bn to under $8bn is worth over $28 of FCF per share.
Jessica Fischer (Chief Financial Officer): We continue to expect total 2026 capital expenditures to reach approximately $11.4 billion. Looking beyond 2026, we expect total capital spending in dollar terms to be on a meaningful downward trajectory. And after our evolution and expansion capital initiatives conclude, our run-rate capital expenditures should be below $8 billion per year. Just to highlight that reduction in capital expenditures, on its own, from approximately $11.7 billion in 2025 to less than $8 billion in 2028, is equivalent to over $28 of free cash flow per share based on today's share count. If we take consensus 2026 free cash flow and substitute our expected 2028 CapEx for 2026 CapEx, our current stock price would imply a free cash flow multiple of only about 3.8x, and a free cash flow yield of over 25%.
p. 4 · Read in context →
Asked to explain the competitive squeeze, Winfrey locates the problem at the top of the funnel, not in price or product.
John Hodulik (UBS); Chris Winfrey (President and CEO): Maybe just — can we get some color on sort of the competitive environment? I think Chris or Jessica, you guys sort of laid out what you're seeing in each of the segments. But from a — are you seeing more pressure on fixed wireless with AT&T's efforts in that area? And then on the fiber side, it seems like there's an aggressive promotional environment, especially around converged offerings. Just wondering if that's having an impact? […] Our issue right now really is a top-of-funnel issue. What do I mean by that? Our yield at the point of sale is as strong as ever. Our churn remains at historical lows, and that's really supported by the value of the products and everything that we're doing to bundle in, which is driving churn lower. The external factors on top of that funnel are really the same: we have new competition, and any form of new competition has impact. Yes, we see continued footprint expansion from cell-phone Internet where AT&T has filled that gap with a fixed wireless access product that originally they said they didn't think made a lot of sense. On the other hand, the pace of gigabit overbuild growth continues at the same pace it's been. Our share in those fiber-overlap areas, as Jessica mentioned, including particularly mature fiber overlap areas, remains above the competition generally across our footprint. The promotional activity varied by competitor during the quarter but there's not a fundamental change in the level of promotional activity. On the external side, we have a continued muted housing environment, slow household formation and low move rates; mobile substitution growth is still present but it seems to be slowing a little bit. […] If you step back, our yield across all channels is good and improving. Churn is low. And the issue about consideration and sales traffic at the top of the funnel comes down to continued improvement in our service reputation, our marketing, our offer expressions, and the way that we're using mobile and video really to drive broadband. We're fully focused on those areas. I'm not going to tell you we're sitting here waiting on a better housing environment, which I do think will happen. But in the meantime, we're focused on what we can do. There's an opportunity to be an even better operator.
p. 8 · Read in context →
Q4 and Full Year 2025 Investor Call — Q4 2025
The full-year call where Charter declined to promise broadband growth, cut its leverage target after shareholder pushback, and set out how it judges competitors' returns. · Open the full transcript →
Management explicitly refuses to forecast a return to broadband growth — the most important sentence on the call.
Christopher L. Winfrey (Chief Executive Officer): Winning connectivity in a cyclical and newly competitive environment is a game of inches. I'm not projecting broadband relationship growth this year. We expect to see an improved trajectory from the investments we've made over the past three years. The recipe for winning here is simple: best connectivity, best overall value, with the best service. And we aren't perfect. We own our mistakes with customers. But we are improving the way we communicate our value, utility, and quality service across our landscape. But I do believe we're the best-positioned company in the connectivity industry, and we will get better.
p. 2 · Read in context →
After a rare quarter of video subscriber growth, the CEO says video net adds are not the goal — broadband retention is.
Christopher L. Winfrey (Chief Executive Officer), answering Jessica Reif Ehrlich (Bank of America): Sure. Look. For video, I want to be really clear. Our north star here, our goal is not to have a net gain in video just for the sake of net gain. Our goal is to have a video product that supports broadband acquisition and broadband retention, and I think it's a powerful tool to do that if we can provide value and utility for customers. I do think the ecosystem is still really challenged. Programming costs continue to go up, and retransmission fees are a real problem. Around that, I think you'll see us continue to innovate. We do have some new product ideas, and we'll communicate with programmers about that in the course of the year. But the key, you know, for us going back to connectivity and acquisition insurance, our added video customer count helps with broadband.
p. 8 · Read in context →
The pricing doctrine stated plainly — low product prices, more products per home — plus how far the 2024 repricing has spread.
Christopher L. Winfrey (Chief Executive Officer), answering Michael Rollins (Citi): Sure. You know this, but by way of background for everybody else, in September 2024, we introduced new pricing and packaging bundled at those lower prices. Despite that, we've been able to maintain consistent ARPU, in many cases growing. In parallel, we’ve used that to first reactively and then proactively migrate good portions of the existing base to lower product pricing while maintaining or actually growing customer relationship ARPU through that process, absent some of the well-known video tier mix. Because people are taking more products per household, that has been a long-held strategy at Charter. Keeping your product pricing low with higher product penetration that leads to improved overall ARPU. By the end of 2025, we were about 40% of our footprint having that new pricing and packaging. We'll probably be at 60% at the end of this year. That has enabled us to manage an environment where we're lowering broadband pricing at both promotion and retail, both in standalone but more importantly in bundled pricing. This creates significant savings for customers.
p. 9 · Read in context →
How Charter judges an overbuilder's economics, and why it will not wait for competitors to behave rationally.
Christopher L. Winfrey (Chief Executive Officer), answering Steven Cahall (Wells Fargo): Regarding the ROI question, I've said this for twenty-five years that when we take a look at ROI, we think about classic IRR cash from cash payback. The danger here is that other people's ROI may be based on a going concern, versus a real financial ROI. You shouldn’t be investing for growing concern ROI. Most shareholders would rather have that capital back instead of deploying it in a poor return scenario. Regardless, that’s the case, and we have to compete irrespective of that. So our job remains to compete against whatever's brought to us, and that's what we've been doing for a long time. When density decreases, the cost per passing ultimately has to go up, thus slowing down the growth of competition. It could be tied to taxes and interest rates, but that isn't our focus. Our focus is on competing effectively.
p. 10 · Read in context →
Q2 2025 Investor Call — Q2 2025
The first call after the Cox agreement: why Charter rebuilt a declining video product, why mobile is now cash-generative, and where the long-run cost advantage comes from. · Open the full transcript →
The question management poses to itself — why invest in a structurally declining product — and the answer.
Christopher L. Winfrey (President and CEO): So why have we worked so hard to improve an ecosystem that's been in structural decline for years? The reason is that we recreated the video product into something of much higher quality with unique video packaging, flexibility, and value. Together with Xumo, which solves a growing content discovery problem, our video product can be yet another competitive advantage for our Internet and mobile sales, and it drives churn lower. It's the convergence of our connectivity services and video through seamless entertainment.
p. 1 · Read in context →
The moment mobile stops consuming cash: EBITDA less capex positive, with no need to subsidize handsets.
Christopher L. Winfrey (President and CEO): From a financial perspective, mobile EBITDA less mobile CapEx is positive. And for the last couple of quarters, that figure has been positive, even including the impact of customer device financing. Outside of our multiline phone balance buyout, we don't see a need to subsidize acquisition given our market-leading speed and value. So the mobile business is now becoming a real tailwind to our free cash flow growth, and it will continue to increase.
p. 2 · Read in context →
The Cox deal framed as an extension of the same strategy, with the specific accretion claims management is on the hook for.
Christopher L. Winfrey (President and CEO): A logical expansion of our strategy was our announcement in May to acquire Cox Communications. This combination offers significant benefits for customers, employees, local communities, and shareholders. The transaction will marry Spectrum's operating strategy with the B2B capabilities and community investment heritage of Cox, together with our shared philosophy of long-term investment in our network and employees. It will bring Spectrum products and prices to the Cox footprint, where we don't operate today, increasing competition in those market to the benefit of consumers and increasing onshore labor to the benefit of employees. This transaction is good for America. It's also a great outcome for both our current shareholders and for the Cox family. The transaction is priced at an attractive valuation, and it's accretive to top-line growth, margin, and to levered free cash flow per share, even when absorbing the impact of a modest delevering of the combined business and without factoring in the benefits of a lower cost of capital and the value of Cox as a sophisticated long-term shareholder.
p. 3 · Read in context →
An analyst catches the tax-savings math not tying out; the CFO's answer turns on assumed share count.
Peter Lawler Supino (Wolfe Research); Jessica M. Fischer (CFO): A question on taxes. You mentioned in your prepared remarks the $10 share benefit per year that might add up to several billion over 5 years, but just multiplying $10 by your share count, and then 5 years, I get maybe twice as much as what I think several billion indicates. […] So Peter, I think that the amount of additional free cash flow that I stated is appropriate, what matters is what you believe about share count over that period of time and how share count might change.
p. 8 · Read in context →
Why cost-to-serve is the structural margin story: fewer transactions, shorter handle times, compounding.
Christopher L. Winfrey (President and CEO), answering Sebastiano Carmine Petti (JPMorgan): The one thing I'd just step back on cost to serve when you think longer-term, not just in the coming quarters, long-term, cost to serve is a huge opportunity and remains the case because the amount of transactions, as I mentioned, is coming down double digits every year. And I think that can accelerate with the benefit of the AI tools that we're putting in front of our agents. It's making the job easier. It's making the handle time go down. It's making repeats go down, which means you've got overall transactions. And you need less labor to handle the transactions because of the lower handle time and the lower number of transactions. And all of that's set to not only continue but to compound. So I feel really good about the long-term trajectory of cost to serve, both in the stand-alone Charter as well as assuming regulatory approval, the combination with Cox. So it remains one of the biggest opportunities in front of the company. And it's why we spent so much time talking about the investments that we've made, not just in AI and machine learning, but also the quality of craftsmanship that exists with our employees because that's the key to getting to that holy grail. And the eventual impact, obviously, in the end isn't really just about cost. It's really about having better retention and having a better Net Promoter Score and customer satisfaction in the marketplace, which drives sales as well. So it all comes together as a virtuous circle that you can have better revenue and lower cost as a result of making the right investments today, and that's what we've been doing for years.
p. 10 · Read in context →
Q3 2024 Investor Call — Q3 2024
The call where the current commercial model was laid out end to end — the Life Unlimited repricing, the service guarantees, and video's return to the bundle. · Open the full transcript →
The service guarantees, and the argument that Charter can afford them because the labor investment is already sunk.
Christopher Winfrey (President and CEO): We back up those commitments with guarantees. For example, to resolve any service disruptions quickly, we commit to dispatch a technician the same day if the customer requests prior to 5 PM. If a customer needs help with professional installation, a technician will be available the same or next day. We now back those commitments with proactive service credits if we miss the mark. We also don't have residential or SMB contracts. If a customer is not completely satisfied with any services within the first 30 days, we give them their money back. […] We're making these commitments because we can, because we've already made the investments in 100% US based sales and service with our own employees in frontline tenure through pay progression, market-leading benefits, and tools and systems to improve the job for the employee and our customers.
p. 2 · Read in context →
Why video came back into the bundle after years of being stripped out — and the limited claim made for it.
Christopher Winfrey (President and CEO): Over the last couple of years, we've moved away from bundling video in our offers because the value proposition to customers had fallen. We still have some work to do to operationalize the new customer proposition, including the customer front end for programmer app authentication and programmer credentials, but we're proud of what we can offer customers, existing and new, in terms of value and utility. And that breakthrough is why we're including video in the new bundles we launched in September. Fundamentally, we believe that maintaining and evolving the video business, even if it isn't growing, helps customer acquisition and retention by making use of our scale and capabilities and adding more value into our unique seamless connectivity relationship. Video still has positive cash flow and provides us with option value.
p. 2 · Read in context →
Q4 and Full Year 2023 Investor Call — Q4 2023
The call where the broadband growth thesis broke: the CEO takes the blame, lays out his read on fixed wireless and fiber returns, and explains why he broke precedent to guide capex to 2027. · Open the full transcript →
Winfrey owns the subscriber miss outright — the sentence the rest of the three-year arc hangs on.
Chris Winfrey (President and CEO): While we are executing well on our long-term strategic initiatives and Spectrum One is working to drive mobile growth, Internet growth in our existing footprint has been challenging, driven by admittedly more persistent competition from fixed wireless and similar levels of wireline overbuild activity. Small changes in gross additions and churn in a low transaction environment have driven outsized impacts to net gains, which was clearly the case as we moved through the last quarter. I own that. So, let me start with what we believe on the competitive environment and then what we’re doing to drive long-term growth by delivering high-quality products and service at a great price.
p. 1 · Read in context →
The framework Charter has used on every call since: fixed wireless as temporary, overbuild damage as bounded and vintage-linked.
Chris Winfrey (President and CEO): Fixed wireless access: While an inferior product with limited capacity and geographic coverage which is fluid, is often marketed by the phone companies at a perceived lower-priced to their existing customers. We continue to believe the impact from fixed wireless is temporary. Our Internet product is faster and more reliable. Our pricing is lower when similarly bundled with mobile. Customer bandwidth needs continue to increase. And MNOs will face capacity challenges and will be required to allocate their Spectrum and capital to maintain profitable mobile services. While we can’t promise when that happens, I believe bandwidth needs to increase and quality and value win. […] On the wireline overbuild front, we continue to compete well. Overbuild impact tends to be limited to a few percentage points of Internet penetration during the first year of a new overbuild vintage coming online. It’s painful, but it’s tied to the pace of overbuild. We don’t see overbuilders reaching their penetration and ROI goals now — within our footprint now or in the future. They don’t have the same ubiquitous convergence capabilities as we do, their lower-cost passings have likely been built, some of the planned overbuild was duplicative between operators, meaning less opportunity, and incremental financing cost have increased, putting even more pressure on overbuilder returns.
p. 1 · Read in context →
The mobile-lowers-churn claim, delivered with the self-selection caveat management could easily have left out.
Chris Winfrey (President and CEO), answering John Hodulik (UBS): The contribution of mobile to the broadband business, the biggest factor so far as you highlighted really has been a significant and a very material amount of churn reduction that takes place on those customers who attach mobile, as I mentioned, it’s only 13% of our base today. And I’d offer you two pieces. One is on the positive side, it is dramatic, the churn reduction. On the — just to be balanced, there’s still self-selection that exists inside that base. So, I want to be careful that we don’t overplay the benefit there on what’s still a relatively small portion of our Internet base and growing and has big upside.
p. 11 · Read in context →
Penetration economics by build type, and the capital-cost argument against treating satellite as a like-for-like rival.
Chris Winfrey (President and CEO), answering Peter Supino (Wolfe Research): And then, in terms of the penetration, Peter, there’s very different types of build that sits in there. […] And other areas where greenfield or market fill-in where penetrations can range anywhere between 45% and 70%, at a lower cost per passing, as Jessica highlighted, than some of the other extension build that we do. […] I think the — let me start with LEO. This is an expensive offering on a month per month basis, expensive from a CPE standpoint. And it needs to be because the — if I told you our network was going to fall to the ground every six to eight years and burn up, you’d tell me that’s a pretty capital-intensive business that needs to be priced appropriately, and it is. I think LEO has a really good use in certain cases, but it’s typically not going to be where our fiber-based network is deployed.
p. 12 · Read in context →
Q3 2023 Investor Call — Q3 2023
The landmark video call: the Disney settlement is turned into a general doctrine for renegotiating every programming contract, with the blackout's cost measured in public. · Open the full transcript →
The hybrid distribution model that reset cable's relationship with programmers, explained in the deal's own terms.
Chris Winfrey (President and CEO): This new hybrid distribution model is good for consumers and we believe a significant step forward for the video ecosystem. For Charter, the agreement adds value to our video packages and better aligns linear content and DTC apps, which will be included for free in our video products. We also maintained flexibility to offer lower cost packages. Disney gets broader distribution of its DTC products with ad revenues from our video customers and upgrade subscriptions to ad free. We’ll also sell Disney’s DTC apps to our Internet customers, including via Xumo over time. Together with Disney, we created a glide path to bridge from linear video into new growth with both linear and DTC services.
p. 2 · Read in context →
The 'don't pay twice' principle generalized to every future renewal — including the threat to drop channels.
Chris Winfrey (President and CEO): Disney and ESPN were a key first step to repairing the video ecosystem, but our goal is to have a product that is valuable and that we’re proud to sell. We plan to modernize all of our distribution agreements upon renewal in a way that works for customers. That means packaging flexibility, value and not asking customers or us to pay twice for similar DTC and linear programming. If programmers insist on customers paying twice, we just won’t carry those channels. But we’d still be happy to sell their content in an à la carte app, same way as they do.
p. 2 · Read in context →
What the Disney blackout actually cost Charter, quantified — and why the damage came in under management's own fears.
Jessica Fischer (Chief Financial Officer): We estimate that approximately 15,000 third quarter Internet disconnects were driven by the temporary loss of ESPN in September. Video customers declined by 327,000 in the third quarter, with about 100,000 video disconnects driven by the Disney programming dispute. The overall impact to customer relationships was less than we expected, facilitated in part by the wide availability of over-the-top alternative. […] Nonetheless, operationally, we handled the Disney dispute very well. But our billing and retention call centers were not fully back to normal until early October, so there was lingering customer net add impact early in the fourth quarter.
p. 3 · Read in context →
More calls
Q3 2025 Investor Call — Q3 FY2025 · 13 pages · Go here for the quarter between the Cox announcement and year-end: video losses down to a quarter of the prior year while Internet losses held flat, and management's account of leaving no stone unturned on go-to-market. · Open →
Q1 2025 Investor Call — Q1 FY2025 · 10 pages · The cleanest data on why Charter thinks bandwidth demand is on its side: 825GB average monthly usage, over 30% of broadband-only customers past a terabyte, and under 13% of mobile traffic on 5G macro towers. · Open →
Q4 and Full Year 2024 Investor Call — Q4 FY2024 · 12 pages · The post-mortem on the Affordable Connectivity Program wind-down — roughly 90% of former ACP customers retained excluding normal churn — plus the hurricane and wildfire impacts. · Open →
Q2 2024 Investor Call — Q2 FY2024 · 12 pages · Read this for management in the middle of the ACP shock, when the open question was framed as customers' ability to pay rather than their willingness to stay. · Open →
Q1 2024 Investor Call — Q1 FY2024 · 11 pages · Useful for the network evolution sequence in plain terms — high split, then distributed access architecture, then 10x1 gig and fiber on demand — and the decision to not chase overbuilder promotions. · Open →
Q2 2023 Investor Call — Q2 FY2023 · 14 pages · The earliest call in the corpus, and the best statement of the original three-initiative plan (evolution, expansion, execution) before broadband growth turned negative. · Open →
Charter Communications, Inc.'s annual reports contain management's most considered account of the business. These are the sections, passages and visual pages worth opening in the originals preserved in Sources.
Charter Communications, Inc. — FY2025 Annual Report (Form 10-K) — FY2025
The current business in management's words, written while two transformative deals - Cox and Liberty Broadband - are still pending. · Open the full document →
Item 1. Business. — p. 7 · Read the full section →
Management's own framing of the strategy: sell more products per relationship, cut service transactions, lower churn.
The stated strategy and the churn-to-profitability logic behind it.
We are a leading broadband connectivity company with services available to 58 million homes and small to large businesses across 41 states through our Spectrum brand. Founded in 1993, we have evolved from providing cable TV to streaming, and from high-speed Internet to a converged broadband, WiFi and mobile experience. […] Our strategy is focused on utilizing our fiber-powered network to deliver high-quality, competitively priced products, with outstanding service, allowing us to increase both the number of customers we serve over our network and the number of products we sell to each customer. This combination also reduces the number of service transactions we perform per relationship, yielding higher customer satisfaction and lower customer churn, which results in lower costs to acquire and serve customers and drives greater profitability.
p. 7 · Read in context →
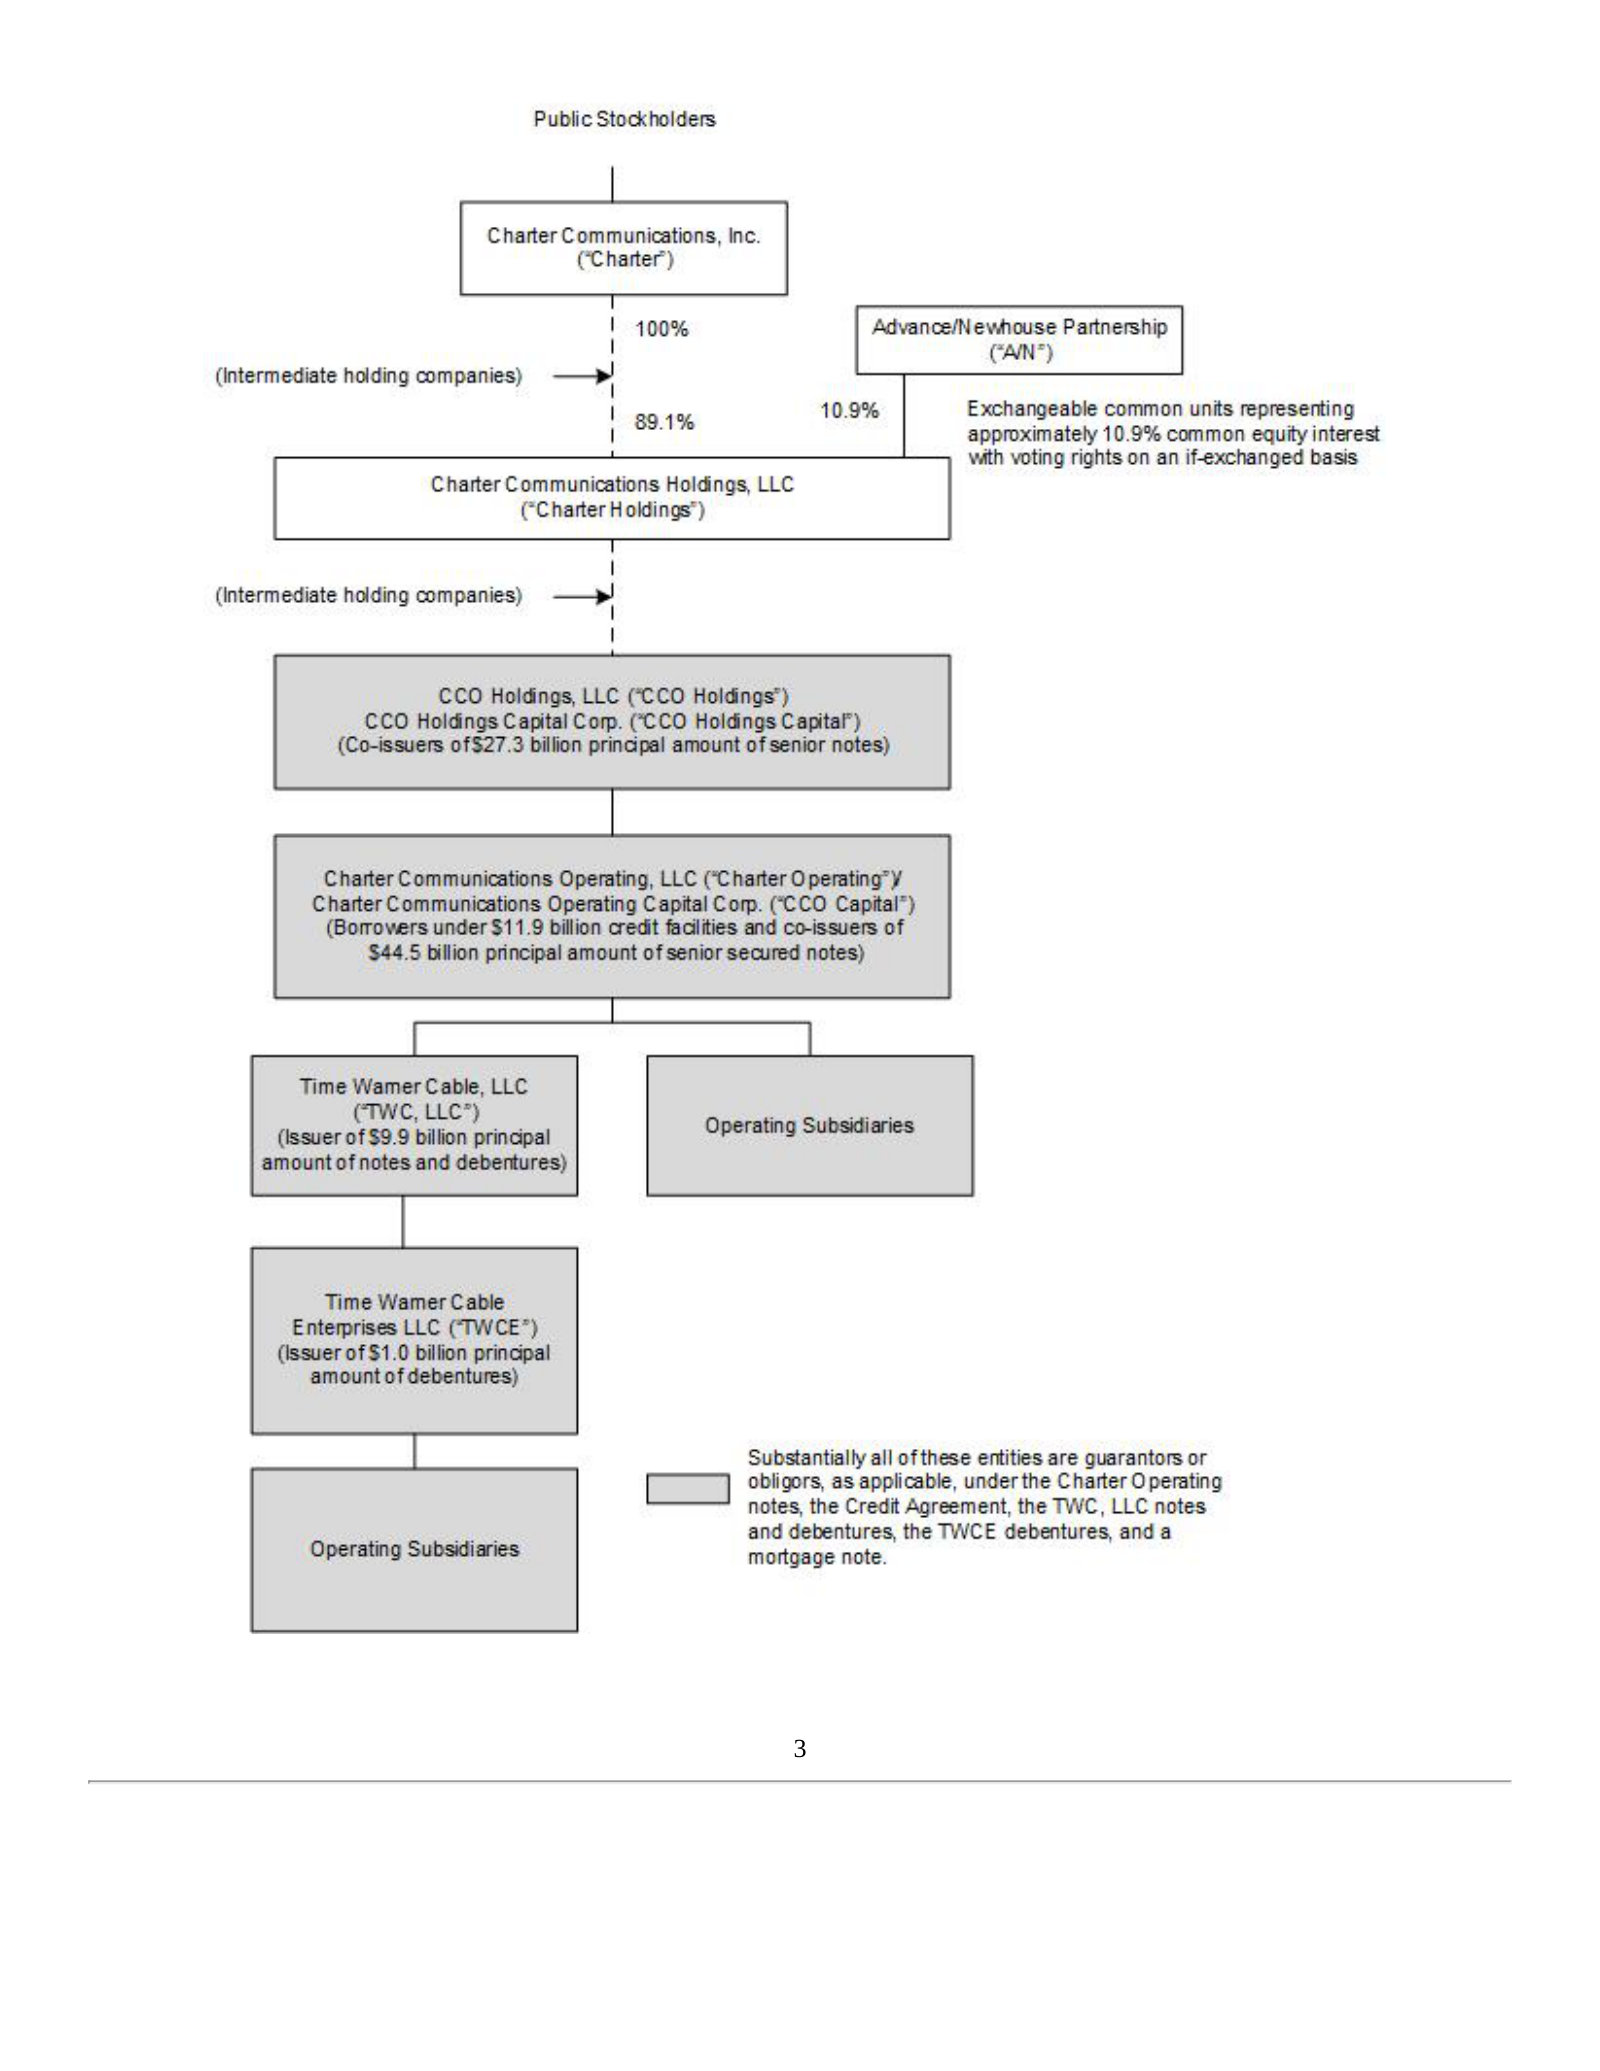
Products and Services — p. 12 · Read the full section →
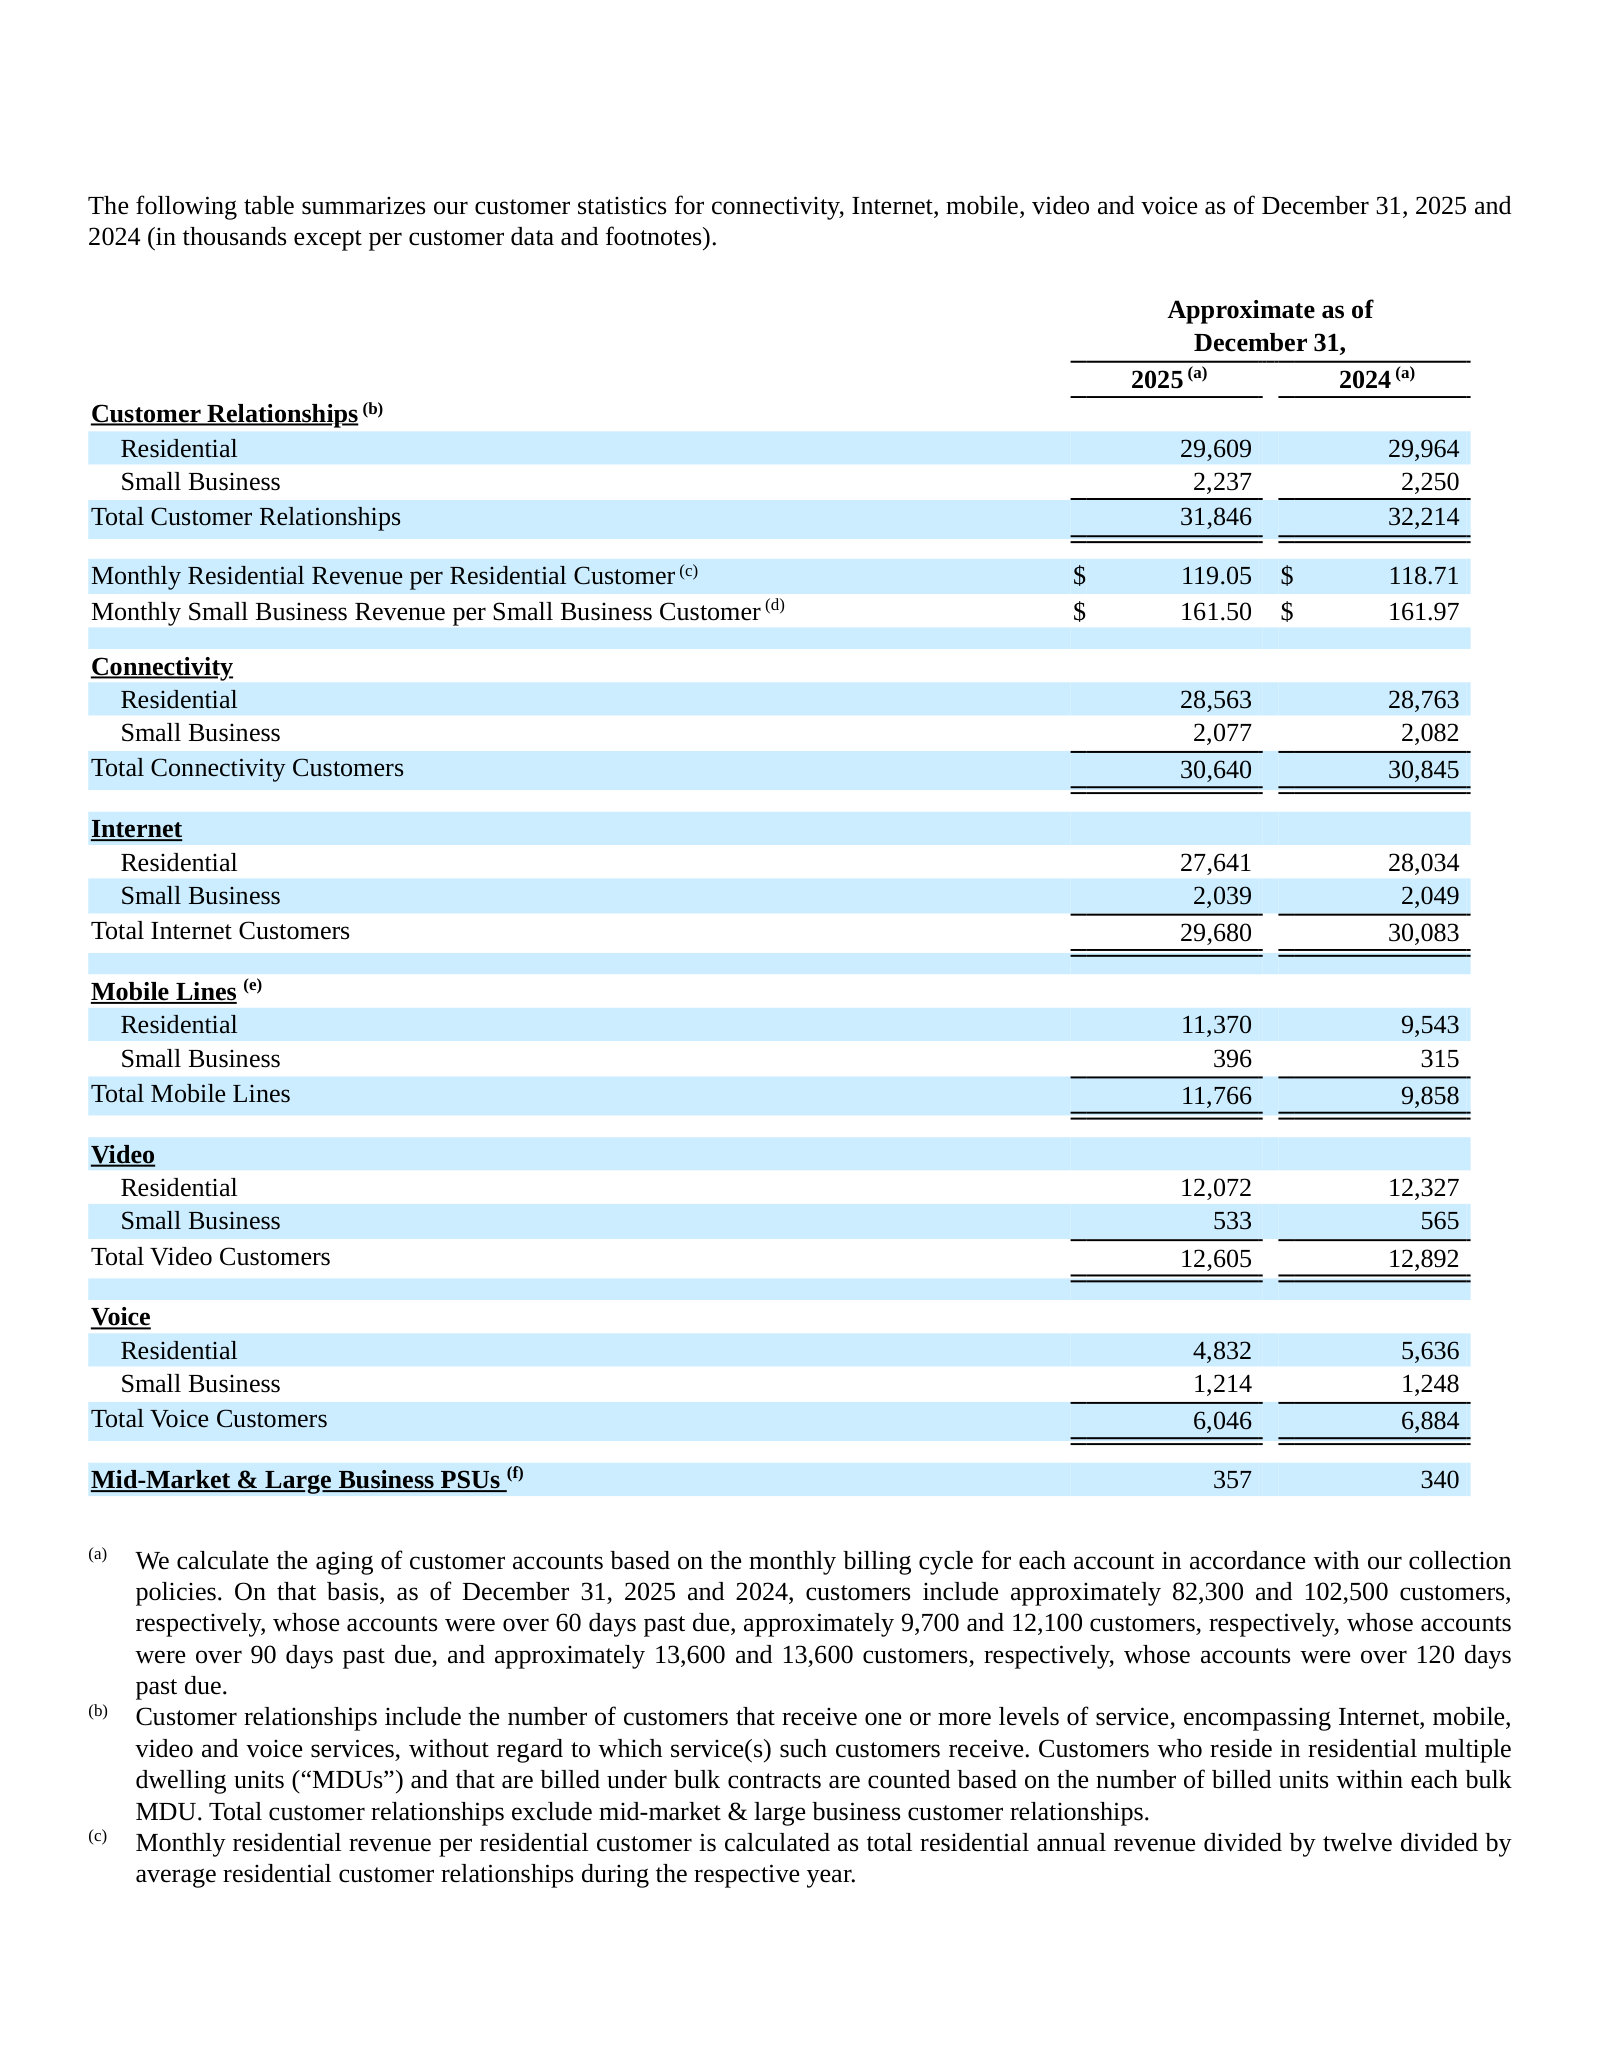
The customer-metric definitions were rewritten in Q4 2025; this table is the base for every per-customer number Charter reports.
What Charter sells, and the fourth-quarter 2025 revision to how customers are counted.
We offer our customers subscription-based Internet, mobile, video and voice services, with prices and related charges based on the types of service selected, whether the services are sold as a “bundle” or on an individual basis, and based on the equipment necessary to receive our services. […] To better reflect the converged and integrated nature of our business and operations, in the fourth quarter of 2025, we revised our customer relationship statistics to include all mobile customers, including mobile-only customers, and have added information on total connectivity customers, which represent all customers receiving our Internet and/or mobile connectivity services. In addition, in the fourth quarter of 2025, certain reporting policies related to mobile lines were revised to better align with other Charter services. Other minor changes were made to small business Internet customers and mid-market & large business primary service units (“PSUs”) to standardize reporting methodologies. Prior periods have been revised accordingly.
p. 12 · Read in context →
Competition — p. 27 · Read the full section →
Names the overlap in numbers - AT&T and Verizon fiber across 27% and 16% of the footprint - rather than in the abstract.
The fiber and fixed-wireless overlap Charter faces on residential Internet.
Our residential Internet service faces competition across our footprint from fiber-to-the-home ("FTTH"), fixed wireless broadband, Internet delivered via satellite and DSL services. […] Several FTTH competitors deliver 1 Gbps broadband speed (and some deliver multi Gbps) in at least a portion of their footprints which overlap our footprint. AT&T Inc. ("AT&T") and Verizon are our primary FTTH competitors. We face terrestrial broadband Internet (defined by the Federal Communications Commission (“FCC”) as at least 100 Mbps) competition from AT&T and Verizon in approximately 27% and 16% of our operating footprint, respectively. […] Several national mobile network operators offer long-term evolution (“LTE”) or 5G delivered cell phone home Internet service (fixed wireless access from cell phone towers) in our markets.
p. 27 · Read in context →
Liberty Broadband Combination — p. 31 · Read the full section →
Charter is absorbing its largest shareholder; the terms and what comes with the deal are set out here.
What Charter takes on: 41.5m of its own shares, $1.8 billion of Liberty debt, $180 million of preferred.
As of December 31, 2025, Liberty Broadband’s principal assets consist of approximately 41.5 million shares of Charter Class A common stock. […] Liberty Broadband has debt of $1.8 billion as of September 30, 2025 that will be repaid prior to closing or assumed by Charter, and $180 million in aggregate liquidation preference of Liberty Broadband preferred stock that will be converted into an equal amount of Charter preferred stock in the Liberty Broadband Combination. The companies currently expect the transaction to close contemporaneously with the closing of the Cox Transactions, unless otherwise agreed, subject to customary closing conditions.
p. 31 · Read in context →
Cox Transactions — p. 31 · Read the full section →
The larger of the two pending deals, and the one that resets leverage - structure and assumed debt in management's words.
The three-part structure of the Cox deal.
On May 16, 2025, Charter, Charter Holdings, and Cox Enterprises, Inc. (“Cox Enterprises”) entered into a Transaction Agreement (the “Transaction Agreement”) pursuant to which (i) Cox Enterprises will sell and transfer to Charter 100% of the equity interests of certain subsidiaries of Cox Communications, Inc. (“Cox Communications”) that conduct Cox Communications’ commercial fiber and managed IT and cloud services businesses (the “Equity Sale”), (ii) Cox Enterprises will contribute the equity interests of Cox Communications and certain other assets (other than certain excluded assets) primarily related to Cox Communications’ residential cable business to Charter Holdings (the “Contribution”), and (iii) Cox Enterprises will pay $1.00 to Charter (collectively, the “Cox Transactions”).
p. 31 · Read in context →
The debt that comes with it: approximately $12.6 billion of Cox net debt and finance leases.
The combined entity will assume Cox Communications’ approximately $12.6 billion in outstanding net debt and finance leases (assumed debt is on a pro forma basis contemplating Cox Communications refinancing of debt maturities occurring between signing and closing of the Cox Transactions).
p. 33 · Read in context →
Item 1A. Risk Factors. — p. 44 · Read the full section →
Two risks that are specific and quantified for Charter: the competitive overlap, and the leverage funding the Cox deal.
Competition in management's words, across Internet, mobile, voice and advertising.
We operate in a very competitive business environment, which affects our ability to attract and retain customers and can adversely affect our business, operations and financial results. […] The industry in which we operate is highly competitive and has become more so in recent years. In some instances, we compete against companies with fewer regulatory burdens, better access to financing and greater and more favorable brand name recognition. […] Our Internet service faces competition from other companies’ FTTH, cell phone home Internet service, Internet delivered via satellite and DSL services. Various operators offer wireless Internet services delivered over networks which they continue to enhance to deliver faster speeds and also continue to expand 5G mobile services as they seek to offer converged connectivity services similar to ours. Our mobile and voice services compete with wireless and wireline phone providers, as well as other forms of communication, such as text, instant messaging, social networking services, video conferencing and email. Competition from these companies, including intensive marketing efforts with aggressive pricing, may have an adverse impact on our ability to attract and retain customers.
p. 44 · Read in context →
$94.6 billion of principal at 4.15x Adjusted EBITDA, before the Cox debt arrives.
We have a significant amount of debt and expect to incur significant additional debt, including secured debt, in the future, as well as additional debt in connection with the Cox Transactions and Liberty Broadband Combination, which could adversely affect our financial condition and our ability to react to changes in our business. […] We have a significant amount of debt, with total principal amount of approximately $94.6 billion and a leverage ratio of 4.15 times Adjusted EBITDA as of December 31, 2025. […] As part of the Cox Transactions, Charter will fund the $4.0 billion of cash consideration using debt and will assume Cox Communications' approximately $12.6 billion of net debt and finance leases.
p. 52 · Read in context →
Item 7. Management’s Discussion and Analysis of Financial Condition and Results of Operations. — p. 80 · Read the full section →
Management on what actually moved 2025: mobile lines up 1.9 million against total revenue down 0.6%.
Valuation and impairment of franchises and goodwill — p. 84 · Read the full section →
$67.5 billion of franchise rights - 44% of assets - carried as indefinite-lived and never amortized; the policy defines the balance sheet.
Why franchise rights are treated as indefinite-lived, and the 2025 impairment headroom.
The carrying value of franchise intangibles as of both December 31, 2025 and 2024 was approximately $67.5 billion (representing 44% and 45% of total assets, respectively), and the carrying value of goodwill as of both December 31, 2025 and 2024 was approximately $29.7 billion (representing 19% and 20% of total assets, respectively). […] Management estimates the fair value of franchise rights at the date of acquisition and determines if the franchise has a finite life or an indefinite life. We have concluded that all of our franchises qualify for indefinite life treatment given that there are no legal, regulatory, contractual, competitive, economic or other factors which limit the period over which these rights will contribute to our cash flows. […] Based on our quantitative analysis, we concluded that the fair value of the franchises in each unit of accounting exceeds the carrying value of such assets by more than 10%.
p. 84 · Read in context →
Liquidity and Capital Resources — p. 96 · Read the full section →
How the debt is actually composed, what free cash flow covers, and where leverage is meant to land after the deals close.
Debt composition, split credit rating, $5.0 billion of free cash flow, and the leverage targets.
We have significant amounts of debt and require significant cash to fund principal and interest payments on our debt. The principal amount of our debt as of December 31, 2025 was $94.6 billion, consisting of $11.9 billion of credit facility debt, $55.4 billion of investment grade senior secured notes and $27.3 billion of high-yield senior unsecured notes. Our split credit rating allows us to access both the investment grade debt and the high yield debt markets. […] Free cash flow was $5.0 billion and $4.3 billion for the years ended December 31, 2025 and 2024, respectively. […] Charter's leverage ratio of net debt to the last twelve months Adjusted EBITDA was 4.15 times as of December 31, 2025. Charter plans to maintain a leverage ratio, pro forma for the closing of the Liberty Broadband Combination near the midpoint of its stated range of 4.0 to 4.5 times Adjusted EBITDA in the period leading up to the Closing, and up to 3.5 times Adjusted EBITDA at the Charter Operating first lien level. Charter plans to adjust its long-term target leverage range after the Closing to 3.5 to 3.75 times Adjusted EBITDA.
p. 96 · Read in context →
Charter Communications, Inc. — FY2024 Annual Report (Form 10-K) — FY2024
Included for one section: the customer statistics on the old definitions, before the Q4 2025 revision restated the base. · Open the full document →
Products and Services — p. 12 · Read the full section →
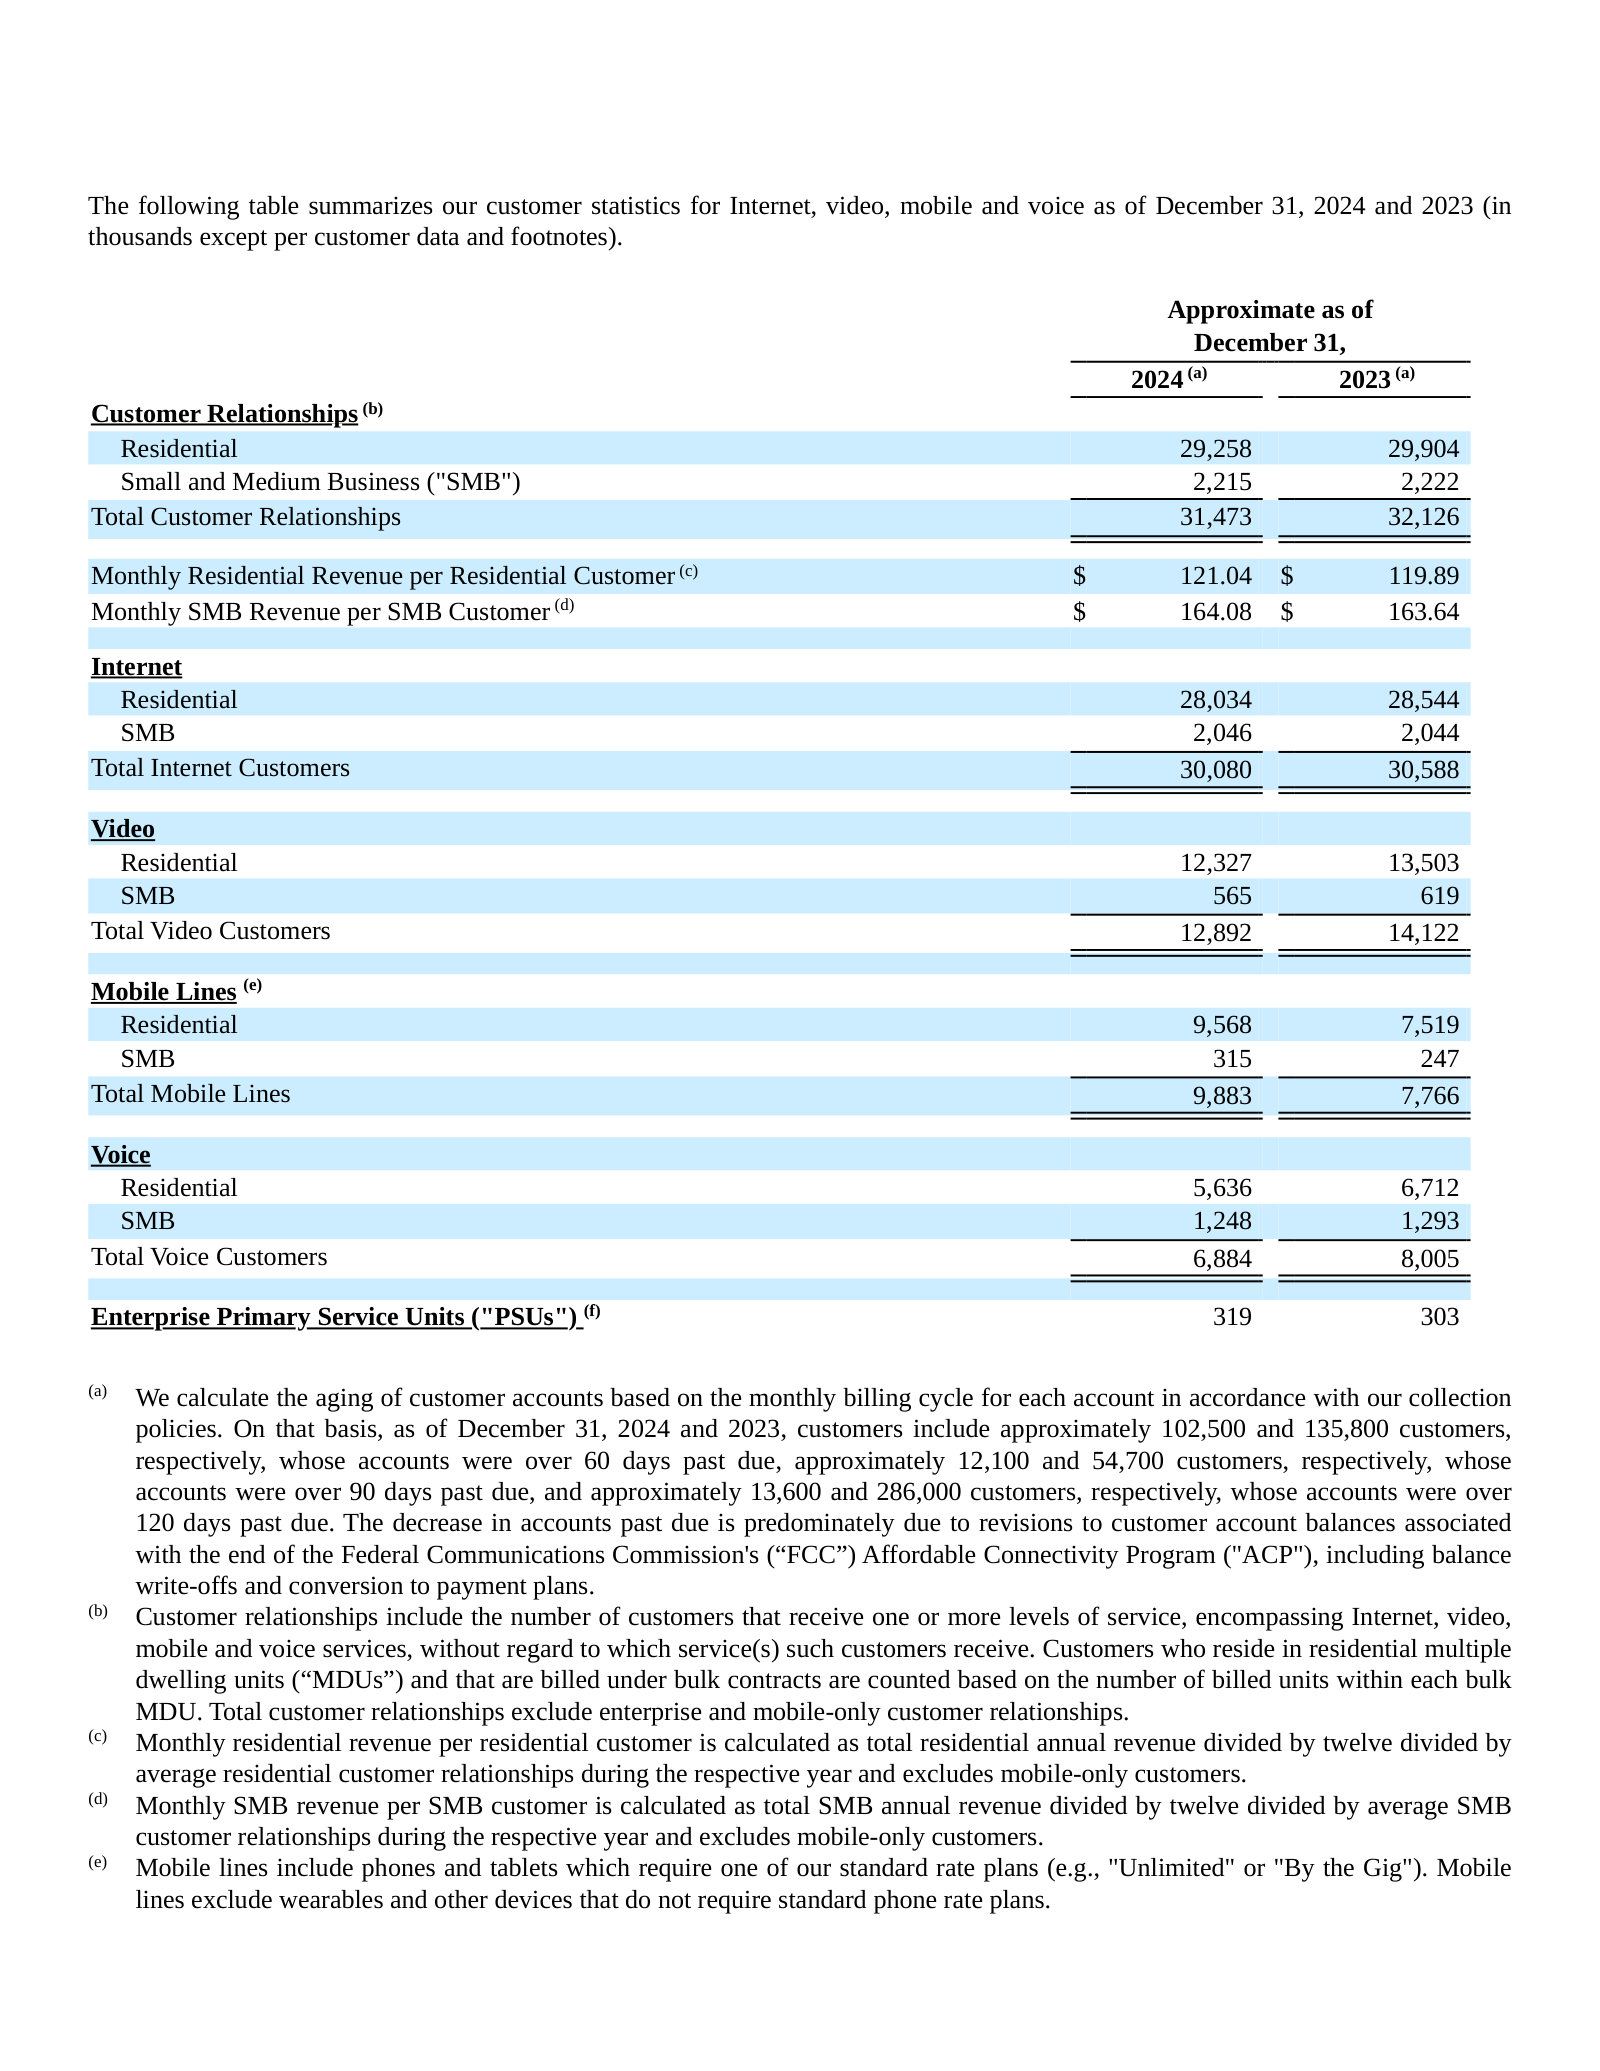
The same table one year earlier on the pre-revision basis - SMB and Enterprise labels, mobile-only customers excluded.
More annual reports
Charter Communications, Inc. — FY2023 Annual Report (Form 10-K) — FY2023 · 174 pages · The last edition written before the Liberty Broadband and Cox transactions were announced - Charter on a standalone basis. · Open →
Charter Communications, Inc. — FY2022 Annual Report (Form 10-K) — FY2022 · 165 pages · First edition to set out the network evolution initiative and the subsidized rural construction build at scale. · Open →
Charter Communications, Inc. — FY2021 Annual Report (Form 10-K) — FY2021 · 181 pages · The pre-build baseline: 15.8 million video customers and 3.6 million mobile lines, before either initiative began. · Open →
Competitors describe Charter Communications, Inc.'s market in their own filings and calls. These verified passages and visual pages show where their strategies meet, using source documents preserved in Sources.
Comcast Corporation (CMCSA)
Comcast is the only US operator running the same machine as Charter: hybrid fibre-coax passing tens of millions of homes, a broadband base under attack from fibre and fixed wireless, a wholesale-hosted mobile product used to defend it, and a shrinking video business. It reports the same metrics one quarter at a time, so its numbers are the cleanest available read-across for Charter's. Only the Connectivity & Platforms discussion is used here; NBCUniversal, Sky, Peacock and the theme parks are out of scope.
Comcast's own picture of where the broadband market settles: most addresses eventually served by two multi-gig symmetrical providers, with fixed wireless taking the price-sensitive, moderate-need tail. The concession inside it matters most for Charter — Comcast says it expects most of its footprint will eventually be overbuilt, and that it does not expect the competitive environment to ease. This is a forward view from an interested party, not a measured market structure, and 'winner' status in the duopoly is asserted rather than demonstrated.
Michael Cavanagh, Co-CEO, prepared remarks (Q3 2025 earnings call): So starting with convergence, the broadband environment remains intensely competitive, which we do not expect to change anytime soon. Over time, though, we believe that the vast majority of the broadband market will be comprised of 2 multi-gig symmetrical providers serving most addresses, and we aim to be a winner in this segment, with the rest of the market likely being served by capacity-limited alternatives. We've been seeing this end state begin to take shape. Fiber expansion continues at a steady pace. And as we've said before, we expect most of our footprint will eventually be overbuilt. At the same time, fixed wireless remains a durable competitor, serving price-sensitive segments with moderate performance needs.
p. 1 · Read in context →
The scoreboard Comcast has chosen to be judged on, and the one Charter's own disclosure now sits beside. Convergence ARPA of roughly $85 against telecom competitors at 'roughly double' is Comcast's framing of headroom, not an independently computed comparison — the peer figure is unsourced and the two sets of accounts are not built the same way. The subscriber lines are audited operating data: broadband losses of 65,000, an improvement of 117,000 year over year, alongside 435,000 wireless net adds and 9.7 million lines at 16% penetration. Note the composition — nearly half of residential postpaid phone connects came in on a free line, so the wireless growth is being bought.
Jason Armstrong, CFO, prepared remarks (Q1 2026 earnings call): Our convergence ARPA, or average revenue per account, currently stands at roughly $85. For context, our telecom competitors are roughly double this amount on the same metric. This really underscores the significant growth opportunity in front of us, especially as we stabilize broadband and look to accelerate growth through wireless. […] Broadband subscriber losses improved by 117,000 year-over-year to 65,000. This improvement reflects traction from our new go-to-market strategy, including improved connects year-over-year, lower voluntary churn, a step-up in take rates on gig-plus speeds and the continued uptake of our free wireless line offer. […] We added 435,000 net wireless lines, our strongest quarter on record with nearly half of our residential postpaid phone connects coming from customers taking a free line. We're deliberately leaning in as our free line offer expands awareness and ultimately widens the base of customers we can drive into paying relationships. We also continue to see a strong uptake in our new premium unlimited wireless plans, accounting for about 30% of our postpaid phone connects reinforcing that we're competing effectively in the higher-value segment of the wireless market. We ended the quarter with 9.7 million total lines at 16% penetration of our domestic residential broadband customer base.
p. 3 · Read in context →
An analyst takes a headwind Charter had disclosed — involuntary, non-pay disconnects after the end of the Affordable Connectivity Program — and asks Comcast whether it sees the same thing. Comcast's answer is that non-pay ticked up only slightly and was offset by steadier connects and voluntary churn. That is management characterisation on a call, not a disclosed number, and the two companies' ACP exposure differed by footprint; but it is the closest thing available to a direct check on whether the pressure was industry-wide or weighted toward Charter. The second half is the network answer that sits opposite Charter's own upgrade programme: gig-plus speeds offered everywhere, upgrades described as ahead of schedule, DOCSIS 4.0 in progress, and WiFi named as the differentiator — all self-assessed.
Craig Moffett (MoffettNathanson) putting the question; David N. Watson, who then led Comcast's cable business, answering (Q2 2025 earnings call). The transcript's inline '(CFO)' label on Watson is the transcription vendor's error.: Let me stay with broadband, if I could. Charter called out involuntary disconnects, there's nonpay disconnects as one of the headwinds. I wonder if you're seeing any of the same thing, which I suspect would point to some continuation of the market impact of discontinuing the ACP program. And then if I think about Project Genesis and where you are with your network upgrades, have you seen any material differences in the way you're competing in Project Genesis markets where you're finished versus where you're not finished yet? What kind of market impact is that having?
David N. Watson (CFO):
Craig, this is Dave. From our perspective, we've noticed a slight increase in nonpay, but it has been offset by stabilization in connects and voluntary churn going into Q2 compared to Q1, as Jason and Mike mentioned. The increase in nonpay isn't significant. Regarding Project Genesis, as Mike discussed the network, we've consistently invested over time, which has positioned us well. Currently, we offer gig-plus speeds everywhere, enabling us to compete effectively across all segments. We're ahead of schedule on upgrades and making rapid progress toward DOCSIS 4.0. Our network is strong, and a key differentiator for us is WiFi, which we define as matching the network's capability. This means great coverage, high speeds, and intelligent management for numerous devices. Overall, our network position looks very robust.
p. 6 · Read in context →
T-Mobile US, Inc. (TMUS)
T-Mobile's fixed wireless access product has been the largest single source of broadband net additions in the US, taking the incremental customer Charter used to win by default, and it is now adding fibre through joint ventures on top. It is also the counterparty on the wireless side of the same market, where Charter resells network capacity rather than owning it. Only the broadband and consumer wireless discussion is used here.
T-Mobile raises its fixed wireless target to 15 million customers by 2030 and puts total broadband at 18–19 million once fibre is included. The line to weigh against Charter is the claim that none of this is 'an overbuild of copper and cannibalization' and that it is all incremental — incremental to T-Mobile, which is not the same as incremental to the market. Every one of those relationships is a household that has to come from somewhere, and cable is the largest incumbent pool. These are company targets, not commitments, and the fibre component depends on joint ventures still being built.
Srinivasan Gopalan, President and CEO, prepared remarks (Q4 2025 results / strategy update): We've said 12 million customers in 2028. Today, I'm delighted to tell you that we believe this business will go to 15 million customers in 2030, and that there's a lot of runway even beyond that. Fiber, we believe, will add three to 4 million customers. Which will give us a broadband business of 18 to 19 million customers by 2030. I'd like to pause for a minute. We would have built a business with 18 to 19 million customers in seven years. Not sure is any company of our size and scale that's done that. 18 to 19 million customers in this industry in broadband, and remember for us, this is all incremental. None of this is an overbuild of copper and cannibalization. All of this is incremental revenue. It's incremental customer relationships that we can nurture.
p. 6 · Read in context →
The mechanics behind the threat, in T-Mobile's own words. It claims industry leadership in broadband net additions at close to 2 million a year from a 2022 standing start, and says its net promoter score is now higher than fibre — a self-reported internal measure, not a published benchmark. The second half explains the cost position Charter is competing against: capacity is allocated hex bin by hex bin, wireless demand at peak hour is reserved first, and only the residue is sold as home broadband. That is what makes the price aggressive, and also what caps it.
Srinivasan Gopalan, President and CEO, prepared remarks (Q4 2025 results / strategy update): Our broadband business to date, largely has been phenomenal. We've led the industry in broadband new customers. And that's from a standing start. You can see we started scaling in 2022. And this business has been running at a real clip. Close to 2 million new customers every year. The industry leader in broadband net adds. And what's driven that again is NPS. What's driven that again is the simple reality of when you give customers a great product, you win. Our NPS today is higher than fiber. […] As all of you know, we've run this business with a fallow capacity model. What does that mean? It means at a hex bin level, and there are 30 million hex bins, it's a small geographical area. Each of those 30 million hexbins what we do is we look at our wireless usage today. We project that forward for growth. And all of this is done at peak hour because that's the only thing that matters for a wireless network. So we look at wireless usage and peak projected for growth going forward. Reserve that capacity for wireless. Whatever is left, is then used for FWA.
p. 7 · Read in context →
Asked directly about buying a cable operator, T-Mobile's CEO rules it out and states the posture instead: 'We see our strength as attacking incumbents rather than becoming an incumbent.' Two things follow for Charter. Consolidation demand from the largest potential acquirer is being publicly withdrawn, and the stated plan is to keep coming at cable from both fibre and fixed wireless. This is a statement of current intent on an earnings call and carries no commitment.
Srinivasan Gopalan, President and CEO, answering Kannan Venkateshwar (Barclays) (Q1 2026 earnings call): Kannan, it just struck me that your reference to large deals potentially was you asking the question I get asked quite often, which is the cable story. As I've said before, we're not going to go do scale for scale's sake. Specifically, cable is not something we're interested in. We see our strength as attacking incumbents rather than becoming an incumbent. We see a huge opportunity to attack incumbents across fiber and fixed wireless access. That will be our key play.
p. 8 · Read in context →
AT&T Inc. (T)
AT&T is the largest fibre overbuilder in the United States and the competitor whose build plan most directly determines how much of Charter's footprint faces a symmetrical multi-gig alternative by 2030. It sells the converged wireless-plus-broadband bundle Charter sells, but owns the mobile network underneath it. Only the Consumer Wireline, Internet Air and convergence discussion is used here; Latin America and Business Wireline legacy are out of scope.
The clearest statement anywhere in the peer set of how a fibre builder intends to price against cable. Stankey says AT&T sits 'under their pricing umbrella,' that cable is 'priced higher and their products are inferior,' and that this is why cable — not AT&T — has to readjust. That is a competitor's characterisation of Charter's product and price position, offered without supporting data, and it is a sales argument as much as an analysis. The structural point underneath it is that AT&T has owners' economics on both fibre and wireless and so, in Stankey's phrasing, does not have to run one product to zero to make the other worthwhile — the asymmetry against an operator that buys its mobile capacity wholesale. The build numbers attached are concrete: 32 million fibre passings at the end of 2025, a stated 40 million at the end of 2026, and roughly five million a year after that.
Peter Supino (Wolfe Research) putting the question; John Stankey, Chairman and CEO, answering (Q4 2025 earnings call): At the same time, Comcast and Charter are behaving differently in terms of the way they price existing customer broadband rates. And so I'm wondering how you're thinking about the price of fiber for your existing subs, your retail rate outlook? […] Look, I've said it before, I think we're in a distinctly different place in cable. One is we currently sit under their pricing umbrella. We're not at their levels. So we have a lot more degrees of freedom in how we manage our ARPUs and our various offers in the market than they have. So it's one thing, understand why they're having to make the changes they're making; they're priced higher and their products are inferior. And so they're the ones that are having to readjust to the market, not us. We've got the better product, we're priced lower. And that's why this is a problem for them. And as a result of that, I think we've got all the actions we need when you think about the fact that we have owners' economics on both our products we can play with the value across and we don't have to run one product to zero to make the other one worthwhile to somebody. I just think we're in a great place for us to be able to manage our value to the customer and what we bring out to them. And when you're doing it on the foundation of a better product, that's a good thing. I made the point I made in my comments for a reason. How do we continue to win and grow and share? We continue to grow our footprint. 32,000,000 fiber passings at the end of 2025, 40,000,000 at the end of this year. That's a growth rate that we've never had. And it's going to be five million a year thereafter.
p. 9 · Read in context →
AT&T's scale claim, stated as a structural advantage 'that others will not catch': more than 90 million locations reachable with fibre or 5G, over 37 million passed with fibre today, 60 million-plus targeted by 2030, and an asserted lower marginal cost per fibre location than any competitor. The superlatives — best and fastest home internet, more scalable reach than any peer — are AT&T's own and unaudited. The passings figures and the 2030 target are the part that bears on how much of Charter's footprint is contested and by when.
John Stankey, Chairman and CEO, prepared remarks (Q1 2026 earnings call): After years of industry-leading investments in our fiber and wireless network, we believe that we have now established a structural advantage that others will not catch. We reached more than 90 million customer locations across the country with our advanced Internet services, over either fiber or 5G. We believe this provides us with more scalable reach and converged connectivity than any of our peers, including a meaningful scale and performance advantage in fiber. This is an advantage we're growing as we ramp our deployment at a faster pace than anyone else. Today, we reach over 37 million customer locations with fiber, and we're on track to reach 60 million plus locations by the end of the decade. As I discussed last quarter, when we complete our work at a fiber location, we believe we're able to offer that customer access to the Internet on a lower marginal cost structure than any competitor, with superior performance and an industry-leading experience on America's best and fastest home Internet.
p. 1 · Read in context →
Where the acceleration came from. AT&T ties a step-up to a four-million-locations-a-year build pace by the end of 2026 and to the tax provisions of the One Big Beautiful Bill Act, then sets out the composition of the 2030 target: roughly 50 million locations built directly, more than 60 million once Lumen's mass-market fibre assets, the Gigapower joint venture and commercial open-access agreements are counted. The distinction matters when reading overbuild risk — open-access and joint-venture locations are reached on different economics from wholly owned build.
John Stankey, Chairman and CEO, prepared remarks (Q2 2025 earnings call): This includes plans to invest a portion of these savings into our network, primarily by accelerating our fiber deployment to a pace of 4 million new locations per year, a run rate we expect to achieve by the end of 2026. This will support good-paying middle-class jobs all right here in the U.S. As a result of our stepped-up investment, we now expect that by the end of 2030, we'll reach approximately 50 million customer locations and reach more than 60 million fiber locations when including the Lumen Mass Markets fiber assets we've agreed to acquire, our Gigapower joint venture and agreements with other commercial open access providers. This would double our fiber reach from more than 30 million total locations, a milestone we reached ahead of schedule during the second quarter.
p. 2 · Read in context →
Verizon Communications Inc. (VZ)
Verizon sits on both sides of Charter: it is the wholesale host for Spectrum Mobile and simultaneously competes for the same households through Fios, the Frontier fibre assets and fixed wireless access. That makes its commentary on the MVNO economics and on its own broadband share unusually load-bearing for Charter's mobile margin story. Only the consumer connectivity discussion is used here.
Verizon confirming the renewed long-term wholesale agreement with Comcast and Charter, and describing it as accretive to Verizon. No terms are disclosed by either side, so the split of economics is unreadable from this text; what it does establish is that the host regards the arrangement as profitable on its own account, which bounds how favourable the pricing can be to Charter. Set against that, the same passage has Verizon at over 30 million fibre passings post-Frontier, adding at least two million this year, targeting 40–50 million, and intending to 'aggressively seize' broadband and mobility share in Frontier markets — supplier and attacker in the same paragraph.
Daniel Schulman, CEO, prepared remarks (Q4 2025 earnings call): First, and obviously crucial to our converged future is the closing of our Frontier acquisition. We now have over 30 million fiber passings with a huge cross-sell opportunity as we are significantly underpenetrated with our wireless services in Frontier markets. I want to thank the entire Frontier team for their focus and execution over the past 18 months. We intend to continue our fiber build-out, adding at least 2 million fiber passings this year, with our goal to reach 40 million to 50 million fiber passings over the medium term. At the same time, we are aggressively driving efficiency through our integration. We now expect to realize over $1 billion of run rate operating cost synergies by 2028, double our initial estimate. These savings will be derived from network integration, third-party contract efficiencies, and go to-market savings across marketing and advertising. The combination of our assets creates a powerful force in the market, and we intend to aggressively seize incremental net adds and share of both mobility and broadband services within Frontier markets. I'm also very pleased to announce that we have completed a comprehensive long-term agreement with Comcast and Charter to continue our partnership. We obviously can't reveal any of the details, but each of us agrees the partnership is on very solid footing financially, operationally, and strategically. It is an accretive deal that ensures their customers remain on the best network.
p. 2 · Read in context →
Verizon's quarterly broadband haul, split between the two technologies that compete with Charter: 341,000 net additions, of which 214,000 fixed wireless and 127,000 fibre, on a base of roughly 16.8 million. 'We continue to take share' is Verizon's characterisation; the disclosed figure is its own net adds, not a measured share shift. The Frontier point is the forward-looking part — it converts a fibre footprint into a cross-sell base for mobility, which is the same convergence logic Charter runs in reverse.
Anthony Skiadas, CFO, prepared remarks (Q1 2026 earnings call): Shifting to broadband. We continue to take share in the first quarter and delivered 341,000 broadband net adds. This includes 214,000 fixed wireless access net adds and 127,000 fiber net adds. We now have approximately 16.8 million broadband subscribers. We are confident in the long-term success of our broadband strategy. Frontier accelerates our opportunity to grow our broadband subscribers as well as our converged offerings, a key enabler to growing wireless share in underpenetrated Frontier markets.
p. 4 · Read in context →
How Verizon files its relationship with Charter for investors: cable companies appear in the competition section as resellers of wholesale capacity, competing with Verizon for retail activations. The paragraph also names the tactics Verizon says are driving intensity — aggressive pricing, promotions, price locks and guarantees, bundled perks, and offers 'in some cases specifically targeting Verizon customers.' This is audited-filing language, but it is a risk narrative: it describes pressure on Verizon and is not a neutral account of who is winning.
Form 10-K for FY2025, Item 1 — Competition and Related Trends: Competition remains intense as a result of various factors, including aggressive pricing, increased levels of promotions and service plan discounts, price locks and guarantees, and offerings that include additional bundled premium content or other perks, in some cases specifically targeting Verizon customers. Competition may increase as MVNOs resell wireless communication services. In addition, aggressive network deployment as well as increasing government incentives related to it may enhance the ability of certain of our competitors to compete with us. The rapid evolution and increasing use of AI technologies also contribute to increasing competition and may affect the competitive landscape in ways we cannot fully predict.
With respect to our wireless connectivity products and services, we compete against other national wireless service providers, including AT&T Inc. and T-Mobile US, Inc., as well as various regional wireless service providers. We also compete for retail activations with resellers that buy bulk wholesale service from wireless service providers, including Verizon, and resell it to their customers. Resellers include cable companies, such as Comcast Corporation and Charter Communications, Inc., and others. Several major cable operators also offer bundles with wireless services through strategic relationships.
p. 11 · Read in context →
Optimum Communications (Altice USA, Inc.) (ATUS)
Altice runs the same hybrid fibre-coax model as Charter in dense Northeast and south-central markets, but with more leverage and a longer record of subscriber decline — it is the closest thing available to a stress case for cable broadband under fibre and fixed wireless attack. It also names Charter directly as one of the operators overbuilding into its territory.
Charter appears in a competitor's filing as an aggressor, not a defender: Altice tells investors that Comcast and Charter are deploying significant fibre and network overbuilds into portions of its footprint. The second half is the warning for anyone modelling Charter's own territory — Altice estimates fibre providers can already sell to over two-thirds of households across its New York, New Jersey and Connecticut footprint, and says the Frontier deal has further consolidated the fibre market against it. That two-thirds figure is Altice's own estimate, disclosed in a 10-K but not independently verified, and it describes Altice's dense Northeast territory rather than Charter's more dispersed one.
Form 10-K for FY2025, Item 1 — Broadband Services Competition: In addition to smaller and regional overbuilders, which use an existing telecommunications operator's network to provide their services, as well as newer fiber providers such as Tachus and T-Fiber, large national providers such as Comcast and Charter are currently deploying significant fiber and network overbuilds in portions of our footprint, increasing the intensity of competition in certain markets. […] We estimate that Verizon, together with other fiber-based service providers, is able to sell fiber-based services to over two-thirds of the households in our footprint in New York, New Jersey, and Connecticut combined […] As a result of Verizon's acquisition of Frontier, Verizon now offers DSL and FTTH broadband service and competes with us in most of our Connecticut service area, as well as parts of our Texas, West Virginia, Arizona, and California service areas. The Frontier acquisition has further consolidated the fiber broadband market and may increase competitive pressures in certain of our service areas.
p. 12 · Read in context →
A cable operator writing down the value of its cable franchise rights by roughly $1.6 billion, and attributing the impairment to competitive and macroeconomic conditions it expects to persist — incremental market entrants and low household move activity. The mechanism is worth separating from the headline: an impairment is a revision of an internal valuation, not a cash event or a subscriber number. What it evidences is that an operator with Charter's asset type has concluded the pressure is structural rather than cyclical. The quarter itself was stable against fixed wireless and fibre until September, when Altice says competitive intensity accelerated sharply.
Dennis Mathew, Chairman and CEO, prepared remarks (Q3 2025 earnings call): Our results in the third quarter reflect shifting dynamics. The first part of the quarter was relatively stable, both against fixed wireless and fiber overbuilders. However, in September, competitive intensity significantly accelerated with aggressive offers paired with heightened marketing spend from our competitors, as well as elevated fixed wireless activity, which impacted our results. In the face of this, we remain disciplined by prioritizing financial stability and protecting margins over chasing lower-value gross additions. At the same time, we recognize that we must be bolder in our go-to-market and base management strategies to stabilize broadband performance. That being said, while we have made progress, we know there is more to do to attain consistent broadband subscriber growth. Reflecting this evolving competitive landscape, in the third quarter, we recorded a noncash impairment charge of approximately $1.6 billion related to our indefinite live cable franchise rights. The fair value of these assets was originally established during the company's formation in 2015 and 2016. Since then, competitive and macroeconomic pressures have evolved, including incremental market entrants and low move activity. The impairment reflects the anticipated persistence of these conditions for the foreseeable future, which are factors that were not contemplated in the original valuations at the time of the Cablevision and Suddenlink acquisitions.
p. 1 · Read in context →
Cable One, Inc. (CABO)
Cable One serves smaller and rural markets of the kind Charter has been extending into with subsidised rural construction, and it is several years behind Charter on mobile. Its management explicitly benchmarks its own moves against what Charter and Comcast have already done, which makes it a useful outside read on whether the cable convergence playbook travels down-market.
A late entrant validating the strategy Charter has been running for years: mobile is described as essential, explicitly on the evidence of what Comcast and Charter have done over the past six to seven years. The qualifier is the useful part — Cable One's new CEO says adoption is not instant, that customers take time to accept a cable provider selling mobile, and that mid-sized operators are hitting the same lag. Read against Charter, it is a competitor conceding the playbook works while describing the ramp as slow.
Jim Holanda, CEO, answering Sebastiano Petti (JPMorgan) (Q4 2025 earnings call): Sebastiano, it's beneficial for us to continue discussions moving forward. Mobile is essential, as demonstrated by the experiences of Comcast and Charter over the past six to seven years. From my experience, it takes time for customers to adapt to the idea of a cable provider offering mobile services, and many of the midsized companies are encountering the same situation. It's not an instant success, but we've learned a lot from those who have gone before us about what attracts customers. This is crucial for how we approach our business and add value for our existing broadband customers, helping them save money on a monthly basis. However, comfort with this concept doesn't happen overnight.
p. 7 · Read in context →
The capital-allocation logic that limits how far overbuild can spread, from an operator that lives in thin markets: where two strong providers already exist, Cable One argues a responsible third entrant generally stays out. It discloses for the first time that about 15% of its footprint faces multi-gig competition, up from high single digits a few years ago. That is a materially lower contested-footprint figure than the large-market peers describe, and it is the counterweight to Comcast's expectation that most of its own footprint will eventually be overbuilt — the economics differ sharply by density.
Todd Koetje, CFO, answering Sebastiano Petti (JPMorgan) (Q4 2025 earnings call): Regarding your question about the multi-gig competition, we haven't previously disclosed the 15% figure. This percentage reflects the overbuilding against DSL and our multi-gig capable broadband service, which has since been upgraded by the LEC. As a result, there are now three providers capable of offering wired gig service, with us being one of them. A few years ago, that number was in the high single digits, so while it hasn't changed dramatically, there has been a slight increase. Generally, when there are already two strong providers, most responsible capital allocation strategies tend to avoid entering as a third. However, if the LEC has improved its offerings after someone else has established services, you may see a gradual increase in competition over time.
p. 8 · Read in context →
More peer documents
Q3_FY2025 — 7 pages · Srinivasan Gopalan describes the FWA target set as 'attacking incumbents who have not invested in their networks and who are charging a large premium' — the sharpest articulation of how T-Mobile positions against cable. · Open →
TMUS_annual_report_FY2025 — 234 pages · Item 1 names Charter first among the non-national wireless competitors and separately as an MVNO threat, showing how a host-network rival files the cable mobile business. · Open →
Q4_FY2025 — 13 pages · Comcast's own account of the modernised Verizon MVNO — framed as supporting profitable growth for Comcast, Charter and Verizon simultaneously — plus mid-split progress at roughly 60% of footprint. · Open →
Q3_FY2025 — 13 pages · AT&T quantifies the dual-technology attack: 31 million fibre locations passed and Internet Air selling in parts of 47 states, which is the fixed wireless overlay on top of the fibre build. · Open →
Q2_FY2025 — 7 pages · Dennis Mathew answers an analyst on whether cable can hold share against established fibre, with claimed win-share gains of 20–40% from hyperlocal go-to-market — the defensive counter-argument to the AT&T and T-Mobile exhibits. · Open →
ATUS_annual_report_FY2024 — 132 pages · The FY2024 competition section, which does not yet name Comcast and Charter as overbuilders — reading it against FY2025 dates when cable-on-cable overbuild entered a peer's risk disclosure. · Open →
CABO_annual_report_FY2025 — 173 pages · Cable One's competition and risk discussion on rural fixed wireless and subsidised overbuild, the market segment Charter's RDOF and BEAD construction is expanding into. · Open →
Source: S&P Capital IQ consensus via Xpressfeed · Generated 2026-08-01.
Estimate momentum
Currency: USD · Scale: money in millions, absolute · Point-in-time consensus; Δ90d is Now versus 90d.
| Metric | FY | 180d | 90d | 30d | Now | Δ90d |
|---|---|---|---|---|---|---|
| EPS (normalized) | FY2027 | $49.37 | $44.22 | $44.67 | $44.11 | -0.2% |
| EPS (normalized) | FY2028 | $53.17 | $46.60 | $47.17 | $48.47 | +4.0% |
| Revenue | FY2027 | $55.01bn | $53.89bn | $53.88bn | $53.71bn | -0.3% |
| Revenue | FY2028 | $56.10bn | $54.08bn | $54.15bn | $53.75bn | -0.6% |
Capex steps down and consensus free cash flow grows 29% then 23% while EBITDA declines
Consensus revenue sits in a roughly 1% band across FY2026-FY2029, and EBITDA is lower in each of FY2026, FY2027 and FY2028 before stabilizing in FY2029. Normalized EPS still rises through FY2028 on that flat-to-lower EBITDA base. Driver-level detail behind capex sits on the Visible Alpha tab.
Currency: USD · Scale: money in millions, absolute · YoY uses the prior fiscal year from the feed; analyst count and range use the first displayed period.
| Metric | FY2025A | FY2026E | FY2027E | FY2028E | FY2029E | YoY | Analysts | Low / high |
|---|---|---|---|---|---|---|---|---|
| Revenue | $54.91bn | $54.26bn | $53.71bn | $53.75bn | $54.00bn | — | 19 | $54.84bn / $55.05bn |
| EBITDA | $22.52bn | $22.25bn | $21.90bn | $21.80bn | $22.22bn | — | 19 | $21.53bn / $22.67bn |
| Capital expenditure | -$11.50bn | -$11.47bn | -$9.54bn | -$8.17bn | -$8.31bn | — | — | — |
| Free cash flow | $4.99bn | $4.70bn | $6.08bn | $7.48bn | $7.10bn | — | — | — |
| Net debt | $95.24bn | $92.40bn | $89.19bn | $85.11bn | $81.31bn | — | — | — |
Revenue has landed within 1% of consensus for eight straight quarters; EPS has swung from -10.5% to +10.2%
Normalized EPS has alternated miss and beat across the last four prints at -10.5%, +5.2%, -9.0% and +2.4%, with no sustained streak in either direction. The largest revenue surprise in the window was +0.98% and the smallest was +0.02%.
Current sequences by metric: Revenue: 2 consecutive beats; EPS (normalized): 1 consecutive beat.
Currency: USD · Scale: money in millions, absolute · Consensus is captured before each actual first became effective.
| Quarter | Metric | Consensus | Actual | Surprise | Outcome |
|---|---|---|---|---|---|
| Q2 FY2026 | Revenue | $13.51bn | $13.53bn | +0.1% | Beat |
| Q2 FY2026 | EPS (normalized) | $10.41 | $10.66 | +2.4% | Beat |
| Q1 FY2026 | Revenue | $13.54bn | $13.60bn | +0.4% | Beat |
| Q1 FY2026 | EPS (normalized) | $10.07 | $9.17 | -9.0% | Miss |
| Q4 FY2025 | Revenue | $13.73bn | $13.60bn | -1.0% | Miss |
| Q4 FY2025 | EPS (normalized) | $9.83 | $10.34 | +5.2% | Beat |
| Q3 FY2025 | Revenue | $13.75bn | $13.67bn | -0.6% | Miss |
| Q3 FY2025 | EPS (normalized) | $9.32 | $8.34 | -10.5% | Miss |
| Q2 FY2025 | Revenue | $13.76bn | $13.77bn | +0.0% | Beat |
| Q2 FY2025 | EPS (normalized) | $9.77 | $9.18 | -6.1% | Miss |
| Q1 FY2025 | Revenue | $13.67bn | $13.73bn | +0.5% | Beat |
| Q1 FY2025 | EPS (normalized) | $8.59 | $8.42 | -2.0% | Miss |
| Q4 FY2024 | Revenue | $13.88bn | $13.93bn | +0.3% | Beat |
| Q4 FY2024 | EPS (normalized) | $9.17 | $10.10 | +10.2% | Beat |
| Q3 FY2024 | Revenue | $13.66bn | $13.79bn | +1.0% | Beat |
| Q3 FY2024 | EPS (normalized) | $8.49 | $8.82 | +3.9% | Beat |
Analysts converge on FY2028 revenue but split on FY2028 EPS, a 34.21-to-59.33 range on nine estimates
Thirteen analysts put FY2028 revenue in a band a few percent wide; nine put FY2028 normalized EPS between 34.21 and 59.33. FY2028 EBITDA and FY2027 GAAP net income carry similarly wide bands on thirteen estimates each.
Currency: USD · Scale: money in millions, absolute · Spread/mean is absolute high-low divided by absolute mean.
| Metric | Period | Mean | Low–high | Spread/mean | Analysts |
|---|---|---|---|---|---|
| Revenue | FY2028E | $53.75bn | $52.20bn–$55.53bn | 6.2% | 13 |
| EPS (normalized) | FY2028E | $48.47 | $34.21–$59.33 | 51.8% | 9 |
| EBITDA | FY2028E | $21.80bn | $19.43bn–$23.06bn | 16.7% | 13 |
| Net income (GAAP) | FY2027E | $4.97bn | $4.11bn–$6.25bn | 43.2% | 13 |
Street snapshot
The target mean of 184.41 sits well above the median of 150, so the average is being pulled by a small number of high targets. The mix is five buys, eleven holds, two underperforms and three sells, plus one no-opinion.
Currency: USD · Scale: money in millions, absolute · Analyst counts shown explicitly.
| Street view | Reading | Analysts |
|---|---|---|
| Recommendation mix | Buy 5, Outperform 0, Hold 11, Underperform 2, Sell 3 | 21 |
| Consensus score | 2.90 | 21 |
| Target price | mean $184.4; median $150.0; high $380.0; low $101.0 | 17 |
FY2029 rests on three to five estimates
FY2029 revenue and normalized EPS carry five estimates each, EBITDA four and GAAP net income three, against sixteen to nineteen for FY2025. The FY2029 normalized EPS range of 27.52 to 64.15 is drawn from those five estimates.
Visible Alpha broker models via S&P Xpressfeed · 19 brokers · 441 line items · freshest revision 2026-07-27.
Charter's broker models describe a business that shrinks and pays. Revenue and EBITDA drift lower through FY-2028, but free cash flow per share climbs from $35.42 to $81.53 as the build spend rolls off and the share count falls. The argument is not the top line, where the models are tightly clustered; it is how fast broadband bleeds, whether mobile earns a real margin, and how much of the cash comes back in buybacks.
Read this consensus as standalone Charter — one broker, and only one, models the Cox transaction
A single broker carries a COX adjustment line — $2.53bn in FY-2026 rising to $4.96bn in FY-2027, plus $1.90bn of associated capex in FY-2027. That is one analyst's view, not a consensus, and every other line on this page is built without it. Coverage also thins as the forecast extends: 17 brokers on FY-2025 EBITDA against 12 on FY-2028.
Modeled as a cash story, not a growth story: FCF per share goes $35.42 to $81.53 as the build rolls off
Capex falls to 14.72% of sales in FY-2028 from 20.96% in FY-2025, almost entirely because line-extension spend falls away. EBITDA never grows in these models, so the cash step-up is a capital-intensity and share-count story rather than an earnings one.
| Line | FY-2025A | FY-2026E | FY-2027E | FY-2028E | YoY | Brokers |
|---|---|---|---|---|---|---|
| P&L | — | — | — | — | — | — |
| Total revenue | $54.91bn | $54.27bn | $53.58bn | $53.52bn | -1.2% | 19 |
| EBITDA | $22.62bn | $22.32bn | $21.84bn | $21.76bn | -1.3% | 19 |
| Capex | — | — | — | — | — | — |
| Capital expenditures | $11.51bn | $11.43bn | $9.44bn | $7.87bn | -0.6% | 17 |
| Line extensions- Capex | $4.01bn | $3.14bn | $2.30bn | $1.94bn | -21.6% | 15 |
| CapEx / Sales(%) | 21.0% | 21.1% | 17.6% | 14.7% | +0.1pt | 17 |
| Cash per share | — | — | — | — | — | — |
| Free cash flow (FCF) | $4.90bn | $4.87bn | $5.87bn | $7.38bn | -0.7% | 17 |
| Free cash flow (FCF) per share($) | $35.42 | $39.93 | $54.88 | $81.53 | +12.7% | 16 |
| Weighted average shares outstanding, Diluted(M#) | 141.11m Number | 121.88m Number | 106.81m Number | 91.53m Number | -13.6% | 19 |
Key drivers
Passings keep growing while subscribers fall, so modeled penetration slides from 50.98% to 44.49% — the losses read as competitive, not as a footprint problem. Price does no work here: ARPU is $71.19 in FY-2025 against $71.31 in FY-2028.
| Line | FY-2025A | FY-2026E | FY-2027E | FY-2028E | YoY | Brokers |
|---|---|---|---|---|---|---|
| Footprint | — | — | — | — | — | — |
| Estimated internet passings(K#) | 58.16m Number | 59.51m Number | 60.73m Number | 61.91m Number | +2.3% | 11 |
| Internet penetration of estimated internet passings(%) | 51.0% | 48.8% | 46.5% | 44.5% | -2.2pt | 15 |
| Subscribers | — | — | — | — | — | — |
| Residential net adds - Internet(K#) | -400,052 Number | -607,176 Number | -811,161 Number | -701,680 Number | -51.8% | 17 |
| Residential subscribers - Internet(K#) | 27.63m Number | 27.03m Number | 26.22m Number | 25.52m Number | -2.2% | 17 |
| Price & revenue | — | — | — | — | — | — |
| ARPU - Residential Internet($) | $71.19 | $70.86 | $70.93 | $71.31 | -0.5% | 17 |
| Residential - Internet revenue | $23.79bn | $23.24bn | $22.68bn | $22.21bn | -2.3% | 18 |
Key drivers
| Line | FY-2025A | FY-2026E | FY-2027E | FY-2028E | YoY | Brokers |
|---|---|---|---|---|---|---|
| Lines | — | — | — | — | — | — |
| Total mobile lines(K#) | 11.87m Number | 13.32m Number | 14.72m Number | 15.96m Number | +12.2% | 13 |
| Mobile lines - net adds(K#) | 1.99m Number | 1.56m Number | 1.39m Number | 1.24m Number | -21.8% | 14 |
| Price | — | — | — | — | — | — |
| ARPU - Residential Mobile lines($) | $29.97 | $30.19 | $30.51 | $30.88 | +0.7% | 11 |
| Revenue & margin | — | — | — | — | — | — |
| Residential - Mobile service revenue | $3.80bn | $4.40bn | $4.97bn | $5.54bn | +15.8% | 18 |
| Total mobile revenue | $6.10bn | $6.60bn | $7.25bn | $7.83bn | +8.2% | 6 |
| EBITDA - Total mobile | $425.15m | $736.99m | $991.64m | $1.20bn | +73.3% | 6 |
The real arguments are the buyback pace, mobile's margin, and when the rural build stops
The share-count row flows straight into every per-share figure on this page. The internet net-adds range is skewed by one low outlier rather than a broad split — judge that row on its quartiles.
| Line | Period | Median | Q1–Q3 | Min–max | Brokers |
|---|---|---|---|---|---|
| Weighted average shares outstanding - Diluted(M#) | FY-2028E | 96.72m Number | 80.46m Number–102.71m Number | 62.37m Number–115.17m Number | 11 |
| EBITDA - Total mobile | FY-2027E | $1.10bn | $774.94m–$1.31bn | $393.82m–$1.38bn | 4 |
| Line extensions- Capex | FY-2027E | $2.10bn | $1.97bn–$2.43bn | $1.38bn–$4.02bn | 11 |
| Residential net adds - Internet(K#) | FY-2027E | -684,000 Number | -723,654 Number–-587,222 Number | -2.31m Number–-513,950 Number | 11 |
| ARPU - Residential Video($) | FY-2028E | $82.92 | $79.68–$84.05 | $74.04–$87.17 | 11 |
Headline P&L consensus, momentum and beat/miss live in the CapIQ tab.
Source: S&P Capital IQ transcripts via Xpressfeed · latest indexed call 2026-07-24 · generated 2026-08-01.
Latest call digest
Charter Communications, Inc., Q2 2026 Earnings Call, Jul 24, 2026 · 2026-07-24T12:00:00
Q2 2026 — July 24, 2026. The prepared remarks and the Q&A pointed in different directions. Chris Winfrey opened on mobile (over 400,000 Spectrum Mobile lines added, 12.5 million total) and on video losses narrowing to 21,000, then framed Charter as an AI-infrastructure owner, citing edge data centers and over 250 megawatts of available capacity after the network evolution completes. Jessica Fischer's math on the free cash flow ramp was the centerpiece: substituting expected 2028 capital expenditures of below $8 billion into consensus 2026 free cash flow implies, on her arithmetic, a free cash flow multiple of a bit over 2x and a yield of nearly 50%.
The operating numbers were weaker. Internet customers fell by 172,000, worse than a year ago, with softer gross additions rather than churn as the driver. Revenue declined 1.7% and adjusted EBITDA fell 3.2% excluding Cox transition expenses. The guidance that mattered was a cut: standalone 2026 EBITDA excluding transition costs is now expected to decline around 1% year-over-year, replacing the "slight EBITDA growth" plan set in January and reaffirmed in April. Fischer also lowered the post-transaction leverage target to a flat 3.5x, announced a capped exchange offer targeting $20 billion of par value investment-grade debt, and said buybacks are paused through the end of the third quarter with a fourth-quarter restart. Cox is now expected to close mid- to late August, with at least $800 million of run-rate transaction synergies and Winfrey volunteering that he thinks it grows to $1 billion.
The Q&A was unusually short — four analysts, no follow-up round — and did not press the two largest disclosures. No one asked about the leverage-target change, the exchange offer, or the buyback pause. Instead the questions ran to broadband ARPU, the EBITDA cut, WiFi offload percentages, and press reports of a Starlink partnership. The most substantive management admission came unprompted: Winfrey said the aggressive Q1 retention offers were a bet that did not pay off, that Charter was slow to pull back, and that he owns the decision.
Participant coverage from the latest call.
| Group | Participants | Count |
|---|---|---|
| Management | Operator; Stefan Anninger — Vice President of Investor Relations, Charter Communications, Inc.; Christopher Winfrey — President, CEO & Director, Charter Communications, Inc.; Jessica Fischer — Chief Financial Officer, Charter Communications, Inc. | 4 |
| Analysts | Craig Moffett — Co-Founder, Founding Partner Senior Managing Director & Senior Research Analyst, MoffettNathanson LLC; Vikash Harlalka — Director on the US Communications Services Team & Lead Analyst, New Street Research LLP; Steven Cahall — Senior Analyst, Wells Fargo Securities, LLC, Research Division; Walter Piecyk — Partner & TMT Analyst, LightShed Partners, LLC | 4 |
Curated latest-call exchanges; one row per analyst topic.
| Analyst | Firm | Topic | What changed in Q&A |
|---|---|---|---|
| Craig Moffett | MoffettNathanson | Broadband ARPU outlook and WiFi offload rate | Moffett asked Fischer to update the positive broadband ARPU outlook she had given two quarters earlier. She said broadband ARPU improves sequentially in Q3 and pointed to the cost pass-through hitting in late July and early August, but redirected to connectivity and customer relationship ARPU rather than restating a full-year broadband ARPU target. Winfrey then attributed the Q2 pressure to the Q1 retention offers and said the company was slow to pull back. On offload, Winfrey said Charter had moved from 88% toward 89% but fell back to 87% in the quarter because a product change pushed more traffic to 5G. |
| Vikash Harlalka | New Street Research | Why the full-year EBITDA target was lowered; Starlink partnership reports | The hardest question of the call. Fischer attributed the change to weaker-than-planned broadband subscribers and ARPU following offers that did not work as expected, plus fuel and medical cost pressure, and pointed to second-half expense actions including benefit plan changes and overhead simplification. Winfrey added that the company is targeting better than the stated outlook. On press reports of a Starlink partnership, Winfrey declined to discuss any specific conversation, saying only that Charter talks to many industry players and there is nothing to announce. |
| Steven Cahall | Wells Fargo Securities | Wholesale offload partnerships and Cox operating trends | Winfrey used the existing Amazon fleet offload deal and the Bryte IQ platform as the template, floated electric vehicle fleets and even mobile operators as potential wholesale offload customers, but stopped short of any commitment. On Cox, he said subscriber and revenue trends run modestly below Charter's and have not changed materially since signing, and that the integration playbook is unchanged. |
| Walter Piecyk | LightShed Partners | Whether Charter would fund a wireless network build; offload traffic mix | Piecyk pressed on whether closing the remaining offload gap could justify capital in a network build. Winfrey and Fischer both ruled it out, with Fischer saying the multiyear capital plan is set and that any such opportunity would have to sit off balance sheet. Winfrey reiterated the capital-light MVNO structure with Verizon on residential and T-Mobile on business, and said the earlier low-90s offload target still holds as CBRS and cross-operator WiFi authentication expand. |
Theme tracker
Themes are curator-classified across supplied calls.
| Theme | Status | Quarters mentioned | Read-through |
|---|---|---|---|
| Convergence: mobile lines as the broadband retention tool | persisted | Q3 2023, Q4 2023, Q1 2024, Q2 2024, Q3 2024, Q4 2024, Q1 2025, Q2 2025, Q3 2025, Q4 2025, Q1 2026, Q2 2026 | Present in every call in the index. The framing hardened over time: from a growth story about the fastest-growing mobile provider, to an explicit churn argument. By Q2 2026 management quantified it, saying Internet customers who also buy mobile churn nearly 40% less, and disclosed mobile penetration of Internet at about 20% with just below two lines per mobile customer. Mobile is now presented as the main defense of a shrinking broadband base rather than as incremental growth. |
| Cox Communications acquisition and integration | emerged | Q2 2025, Q3 2025, Q4 2025, Q1 2026, Q2 2026 | First discussed on the Q2 2025 call after the May 2025 announcement and increasingly dominant since. The expected close slipped from mid-2025 language, to a summer close pending California, to mid- to late August 2026. Synergy estimates moved from $500 million to at least $800 million, with Winfrey saying in Q2 2026 he expects $1 billion. The deal has become the primary source of management's growth argument as standalone broadband and EBITDA trends deteriorated. |
| Deleveraging commitments ratcheting tighter | persisted | Q3 2024, Q4 2024, Q2 2025, Q3 2025, Q4 2025, Q1 2026, Q2 2026 | The target has moved in one direction across four consecutive calls: 4.0x to 4.5x through Q4 2024, then 3.5x to 4.0x with a midpoint objective at Q2 and Q3 2025, then the low end of a 3.5x to 3.75x range at Q4 2025 and Q1 2026, then a flat 3.5x at Q2 2026. Management attributed each step to shareholder and bondholder preference for less leverage in a lower-growth period. The Q2 2026 step added a $20 billion capped exchange offer and a buyback pause through the third quarter. |
| Video re-bundled as a broadband acquisition and retention asset | persisted | Q3 2024, Q4 2024, Q1 2025, Q2 2025, Q3 2025, Q4 2025, Q1 2026, Q2 2026 | The 'seamless entertainment' construct first appears on the Q3 2024 call and has featured in every call since, alongside Xumo, the programmer app inclusion offers and the Spectrum App Store. Results followed the narrative: video losses fell from 294,000 in Q3 2024 to a 44,000 gain in Q4 2025 and a 21,000 loss in Q2 2026. Notably, analysts stopped asking about video after Q4 2025 — the topic persists in prepared remarks but has left the Q&A. |
| AI: from cost-to-serve savings to a revenue and infrastructure story | emerged | Q4 2024, Q1 2025, Q2 2025, Q3 2025, Q4 2025, Q1 2026, Q2 2026 | AI enters the prepared remarks in Q4 2024 as frontline agent tooling and peaks in Q3 2025, where Winfrey framed agentic AI against an $8 billion annual cost to serve and said the benefit was probably 12 to 18 months away. By Q2 2026 the framing had shifted outward to network demand, data center connectivity and edge data center capacity. The cost-savings claim has not yet been quantified in results; the newer infrastructure claim is directional only. |
| Affordable Connectivity Program wind-down | dropped | Q3 2023, Q4 2023, Q1 2024, Q2 2024, Q3 2024, Q4 2024, Q1 2025, Q2 2025 | ACP was the dominant explanation for subscriber weakness through 2024, peaking on the Q2 2024 call, and was still being used to explain elevated non-pay churn in Q2 2025. It is mentioned only in passing on the Q3 and Q4 2025 calls and disappears entirely from Q1 and Q2 2026. The disappearance matters because the losses did not: the 172,000 Internet loss in Q2 2026 exceeds the 149,000 loss in the ACP-affected second quarter of 2024, so the explanation has shifted to gross-add softness with no one-time item behind it. |
| Fiber overbuild and fixed wireless competition | persisted | Q4 2023, Q1 2024, Q2 2024, Q3 2024, Q4 2024, Q1 2025, Q2 2025, Q3 2025, Q4 2025, Q1 2026, Q2 2026 | Management's line has been consistent — fiber overlap grows at a steady pace, Charter holds higher share than fiber competitors even in mature overlap, and overbuilders will not reach their return targets. What changed is the fixed wireless component: cell phone Internet was described as having peaked or plateaued in Q4 2024 and Q1 2025, then re-emerged in Q3 2025 and after as AT&T expanded its footprint, which management now cites as an active headwind rather than a fading one. |
| Subsidized rural build and capital wind-down | persisted | Q3 2023, Q4 2023, Q1 2024, Q2 2024, Q3 2024, Q4 2024, Q1 2025, Q2 2025, Q3 2025, Q4 2025, Q1 2026, Q2 2026 | Rural passings growth has been delivered consistently, exceeding the 450,000 target in 2025, and BEAD participation was deliberately kept small at roughly 84,000 passings and about $230 million of net capital. 2026 is described as the last large build year. This is the operational underpinning of the capital step-down that now carries most of the equity story. |
| Service reputation and Net Promoter Score as the growth unlock | emerged | Q3 2024, Q4 2024, Q1 2025, Q3 2025, Q4 2025, Q1 2026, Q2 2026 | Begins with the September 2024 customer commitment and Life Unlimited relaunch, and escalates: NPS entered granular incentive plans for 2026, and by Q2 2026 Winfrey named improving NPS as a precondition for returning to broadband growth and tied the hire of Nick Jeffery as COO to it. The claim is now load-bearing for the growth case but remains unsupported by any disclosed metric in the transcripts. |
Guidance ledger
Quotes, calls, and speakers are source-verified; outcomes are curator-classified.
| Verbatim guidance | Call | Speaker | Curator outcome | Outcome note |
|---|---|---|---|---|
| “For the full year 2026, we are planning for slight EBITDA growth, excluding the impact of transition costs.” | Charter Communications, Inc., Q4 2025 Earnings Call, Jan 30, 2026 · 2026-01-30T13:30:00 | Jessica Fischer | missed | Reaffirmed on the Q1 2026 call, then replaced two calls later: on Q2 2026 Fischer said standalone Charter EBITDA excluding transition costs is now expected to decline around 1% for the full year. The full year is not complete, but management has withdrawn the growth plan. |
| “Currently, for the full year 2026, we expect standalone Charter EBITDA, excluding the impact of transition costs, to decline around 1% year-over-year.” | Charter Communications, Inc., Q2 2026 Earnings Call, Jul 24, 2026 · 2026-07-24T12:00:00 | Jessica Fischer | pending | Set on the most recent call. Fischer and Winfrey both said they are working to do better than this trajectory through second-half cost actions, political advertising and the summer cost pass-through. |
| “We expect 2025 full year EBITDA growth to be flat or marginally positive year-over-year with higher underlying growth absent the impact of political advertising.” | Charter Communications, Inc., Q3 2025 Earnings Call, Oct 31, 2025 · 2025-10-31T12:30:00 | Jessica Fischer | kept | On the Q4 2025 call Fischer reported that for the full year 2025 EBITDA grew by 0.6%, within the stated range. |
| “We now expect total 2025 capital expenditures to reach approximately $11.5 billion versus $12 billion previously, primarily due to the timing of network evolution spend and lower line extension spend spread in commercial and subsidized rural.” | Charter Communications, Inc., Q2 2025 Earnings Call, Jul 25, 2025 · 2025-07-25T12:30:00 | Jessica Fischer | missed | Fischer reported on the Q4 2025 call that 2025 capital expenditures totaled $11.66 billion, which she described as slightly above the $11.5 billion expectation, attributing the difference to two multiyear software agreements accrued in the fourth quarter. |
| “We continue to expect total 2026 capital expenditures to reach approximately $11.4 billion.” | Charter Communications, Inc., Q1 2026 Earnings Call, Apr 24, 2026 · 2026-04-24T12:30:00 | Jessica Fischer | pending | Reaffirmed for standalone Charter on the Q2 2026 call. Q1 and Q2 2026 capital expenditures were $2.9 billion each. |
| “We expect subsidized rural passings growth of approximately 450,000 in 2026, our last large build year, in addition to continued nonrural construction and fill-in activity.” | Charter Communications, Inc., Q4 2025 Earnings Call, Jan 30, 2026 · 2026-01-30T13:30:00 | Jessica Fischer | pending | Subsidized rural passings grew by 89,000 in Q1 2026 and 127,000 in Q2 2026. The comparable 2025 target of approximately 450,000 was exceeded, with over 483,000 added in the trailing twelve months at year-end. |
| “We now estimate transaction synergies, or run rate operating expense synergies, of at least $800 million and are likely to grow that further.” | Charter Communications, Inc., Q1 2026 Earnings Call, Apr 24, 2026 · 2026-04-24T12:30:00 | Jessica Fischer | pending | Raised from the $500 million estimate discussed at announcement. On the Q2 2026 call Winfrey reiterated at least $800 million and said he thinks it will grow to $1 billion after close, which had not yet occurred. |
| “In total, we expect to spend approximately $230 million of our own capital net of subsidies to build out those passings over the next several years.” | Charter Communications, Inc., Q3 2025 Earnings Call, Oct 31, 2025 · 2025-10-31T12:30:00 | Jessica Fischer | pending | Carried into the multiyear capital outlook on the Q4 2025 call, where Fischer said the roughly $230 million of BEAD line extension spend falls mostly in 2027 to 2029. |
| “We currently expect under existing tax legislation that our calendar year 2025 cash tax payments will total between $1.6 billion and $2 billion.” | Charter Communications, Inc., Q4 2024 Earnings Call, Jan 31, 2025 · 2025-01-31T13:30:00 | Jessica Fischer | unknown | The basis changed rather than the execution. Fischer flagged the conditionality at the time, and on the Q2 2025 call cut the range following the July 2025 federal tax legislation. Full year 2025 cash tax payments came in just under $900 million. |
| “Post close, however, we will move our long-term target leverage to 3.5x to 4.0x, and we would expect to delever to the middle of that range within 2 to 3 years following close.” | Charter Communications, Inc., Q3 2025 Earnings Call, Oct 31, 2025 · 2025-10-31T12:30:00 | Jessica Fischer | unknown | Superseded before it could be tested. The target was tightened to the low end of a 3.5x to 3.75x range on the Q4 2025 call and to a flat 3.5x on the Q2 2026 call, in each case attributed to investor preference rather than to a change in the underlying plan. |
Q&A pressure map
Question counts and firms are curator tallies; analyst coverage shown above.
| Topic | Questions | Firms | Pressure / response |
|---|---|---|---|
| Broadband subscriber trajectory and top of funnel | 7 | Evercore ISI, Morgan Stanley, New Street Research, UBS Investment Bank, Wolfe Research, MoffettNathanson, Wells Fargo Securities | The single most persistent line of questioning across the last eight calls, and the one management has answered least specifically. The framing shifted from when losses would stop, to what evidence exists that anything is improving. Moffett's Q3 2025 question asked directly for data showing improving share or retention; the answer described churn benefits from bundling and macro headwinds without offering the requested evidence. Winfrey's flat 'I do' on Q1 2025 when asked whether the plan alone would restore growth has not been repeated since. |
| Broadband ARPU and pricing strategy | 8 | Morgan Stanley, New Street Research, Citigroup, Wells Fargo Securities, Raymond James & Associates, JPMorgan Chase & Co, MoffettNathanson | Analysts have asked in five of the last six calls whether promotional migration, price locks and retention offers are eroding revenue per customer. Management's consistent response is that it manages to customer relationship ARPU rather than product ARPU. On Q2 2026 this became a visible mismatch: Moffett asked for an update to a specific full-year broadband ARPU commitment, and Fischer answered with sequential direction plus the relationship-ARPU reframing without restating or retracting the original target. |
| EBITDA guidance credibility and cost management | 8 | UBS Investment Bank, JPMorgan Chase & Co, Morgan Stanley, New Street Research, Goldman Sachs Group | Pressure here has escalated as the guidance moved. Swinburne noted on Q3 2025 that the fourth-quarter EBITDA signal had reversed within a quarter, and Fischer conceded that offers tested in Q3 hit ARPU more than expected without driving the sales anticipated. Harlalka's Q2 2026 question — what changed in six months — drew a similar answer about offers that did not work, plus fuel and medical costs. The pattern of offer experiments damaging ARPU has now been acknowledged twice. |
| Mobile economics, MVNO terms and WiFi offload | 9 | Evercore ISI, MoffettNathanson, Morgan Stanley, Wells Fargo Securities, LightShed Partners | Moffett has raised offload or MVNO structure on three of the last eight calls, and the Q2 2026 call was dominated by it: four of the five analyst questions touched mobile network economics or offload. Management has been consistently open on offload percentages and consistently unwilling to discuss MVNO pricing. The Q2 2026 answer that offload fell from 88% to 87% because a product change pushed more traffic to 5G was volunteered rather than extracted. |
| Cox integration, migration pace and synergies | 7 | MoffettNathanson, Wells Fargo Securities, BofA Securities, Raymond James & Associates, JPMorgan Chase & Co | Questions have concentrated on one worry: Cox's higher broadband ARPU falling when Spectrum pricing is introduced. Management's answer has been stable across three calls — customer relationship ARPU and EBITDA margin are similar, and low Cox video and mobile penetration provides the offset. Analysts have not yet pressed on the closing delay costs, though Fischer disclosed $65 million of transition expense in Q2 2026 and said transition costs have run higher than expected. |
| Competitive intensity: fiber, fixed wireless and satellite | 7 | Morgan Stanley, Deutsche Bank AG, New Street Research, Wells Fargo Securities, UBS Investment Bank | Fiber questions have narrowed over time as management's share answer stayed consistent, while satellite entered the Q&A only in the last two calls. On Q2 2026 Harlalka asked directly about reported Starlink partnership talks; Winfrey answered about the general practice of talking to industry players and said there was nothing to announce, which does not address whether specific talks occurred. |
| Further cable consolidation beyond Cox | 5 | Morgan Stanley, MoffettNathanson, BofA Securities | Recurring through late 2024 and revived on Q1 2026, when Diffley asked how the regulatory environment frames further consolidation. Winfrey said Charter would like to acquire more cable assets at the right price and that each cable operator is a regional competitor against national and global players. On Q2 2026 he closed the topic himself, noting investors have been asking what comes next and redirecting to Cox execution. |
| Capital intensity and the multiyear capex envelope | 3 | New Street Research, MoffettNathanson, Goldman Sachs Group | Questioned mainly in late 2024 and 2025, when the outlook was being set. The pressure has faded as the numbers held: Winfrey told analysts on Q2 2025 they could take the Charter capital outlook literally to the bank, and the sub-$8 billion run-rate figure has been repeated in every call since without challenge. This is the one area where analysts appear to have stopped testing management. |
Language shifts
Only language evidence verified against the referenced component is shown.
| Observation | Verbatim evidence | Call ID | Component |
|---|---|---|---|
| By Q4 2025 the same commitment carried an explicit carve-out for the year ahead, and the framing moved to marginal gains rather than a turn. | “I'm not projecting broadband relationship growth this year, but we expect to see an improved trajectory from the investments we've made over the past 3 years.” | 1974724673 | 2 |
| In Q2 2026 the timing commitment was dropped altogether and replaced with a contrast between an uncertain subscriber recovery and a certain cash flow outcome. The rhetorical move relocates confidence from the operating business to the capital plan. | “The timing of all that is hard to predict, but our cash flow growth is not, and we have full confidence in the significant free cash flow ramp we're about to see.” | 2008048266 | 2 |
| New in Q2 2026: first-person accountability for a specific commercial decision. Across the prior eleven calls, weak results were attributed to macro conditions, new competition, ACP or housing. This is the first instance of a named error owned by the CEO. | “And it had some impact, but not enough to really merit what we did. So we pulled back. I own that.” | 2008048266 | 7 |
| Starlink is named in prepared remarks for the first time in the reviewed history, with hedged monitoring language rather than the dismissive framing previously applied to fixed wireless. On Q1 2026 satellite came up only in response to an analyst question. | “As it relates to satellite, so far, we haven't observed meaningful share loss to Starlink, including in our subsidized rural footprint, but we continue to monitor it closely and take it seriously.” | 2008048266 | 3 |
| The leverage discussion moved from routine capital-structure commentary to defensive assertion. Fischer pre-empted doubt about the new target rather than answering a question about it, and no analyst raised leverage in the Q&A. | “Our leverage target is not aspirational. We have high confidence in the strength of our business and its ability to generate substantial cash flow to achieve our targets.” | 2008048266 | 3 |
| The AI vocabulary shifted from internal cost reduction to an external infrastructure claim. Through Q3 2025 AI was framed against the roughly $8 billion cost to serve; by Q2 2026 it is framed as a demand driver, with no revenue attached. | “We provide the mission-critical AI infrastructure that will ultimately demand our superior speed, reliability and low latency capabilities.” | 2008048266 | 2 |
Across twelve quarters the operating narrative has stayed remarkably stable while the numbers behind it have not, and the burden of the equity case has migrated from subscriber recovery to a capital step-down that is largely arithmetic. The call history is most useful as a record of how quickly the financial commitments have moved — a full-year EBITDA growth plan withdrawn within two quarters, a leverage target tightened three times in four calls — which argues for weighting the mechanical free cash flow math more heavily than the guidance surrounding it.
Business and Balance Sheet
Bottom line. Charter sells broadband, mobile, video and voice under the Spectrum brand to about 31.7 million customers across 41 states. In FY2025 it turned $54.8 billion of revenue into $22.7 billion of Adjusted EBITDA and $5.0 billion of free cash flow, against $94.6 billion of debt. Revenue has been flat for four years, broadband subscribers have fallen for two, and the listed equity is now roughly one-seventh of enterprise value.
What the company sells
Charter is a cable operator. It owns a hybrid fibre-coaxial network that reaches 58 million homes and businesses across 41 states, and it sells connectivity over that network under the Spectrum brand [1]. The capital is sunk; the economics move with how many of those 58 million passings buy service and how many products each buyer takes.
At the end of 2025 that was 31.85 million customer relationships — 29.68 million taking internet, 12.61 million taking video, 6.05 million taking wireline voice, and 11.77 million mobile lines riding on a wholesale agreement rather than Charter's own spectrum [2]. The average residential customer paid $119.05 a month [3].
Source: FY2025 Annual Report (Form 10-K), Management Discussion and Analysis — Revenues by service offering [4].
Two lines carry the business. Internet alone was $23.8 billion of FY2025 revenue and grew 1.7%; video was $13.7 billion and fell 9.4% [5]. Mobile is the fast-growing line — $3.8 billion, up 22.0% — but it is still only 7% of revenue and is resold over another carrier's network [6]. Commercial services, at $7.3 billion, grew 0.9%. Video's decline is partly presentational: $322 million of the FY2025 fall came from costs allocated to programmers' streaming apps and netted inside video revenue rather than from lost customers [7].
The subscriber turn
Broadband subscriber counts drive the model, and they changed direction two years ago. Total internet customers grew through 2023, to 30.59 million [8]. They fell in 2024, when residential internet customers dropped 510,000 as the federal Affordable Connectivity Program subsidy wound down [9]. They fell again in 2025, by a further 393,000 residential [10]. In the first quarter of 2026 the loss ran at 120,000 for the quarter, against 59,000 in the same quarter of 2025 [11].
Sources: FY2023 Form 10-K, customer statistics [12]; FY2025 Form 10-K, customer statistics [13]; Q1 2026 results release [14].
Mobile is the offset, and it is a real one: lines more than doubled from 5.29 million at the end of 2022 to 12.13 million at the end of the first quarter of 2026 [15] [16]. But mobile adds are also decelerating — 368,000 in the first quarter of 2026 against 507,000 a year earlier — and each mobile line carries a wholesale cost that a broadband line does not [17].
Penetration shows the mismatch directly. Charter's estimated passings grew 2.6% over the year to 58.66 million, with subsidised rural construction supplying more than 483,000 of that gain [18], while customer relationships fell 1.5%. Penetration of passings went from 56.3% to 54.0% [19]. The company is building past more homes and selling to a smaller share of them.
What the business earns
Sources: FY2023 Form 10-K, consolidated statements of operations [20] and Adjusted EBITDA and free cash flow reconciliation [21]; FY2025 Form 10-K, consolidated statements of operations [22] and Adjusted EBITDA and free cash flow reconciliation [23].
Revenue has moved within a $1.1 billion band for four years: $54.0 billion in 2022 and $54.6 billion in 2023 [24], then $55.1 billion in 2024 and $54.8 billion in 2025, a decline of 0.6% [25]. Adjusted EBITDA has ground higher across the same span, from $21.6 billion to $22.7 billion, on cost discipline rather than growth [26] [27].
Most of that EBITDA does not reach free cash flow. Charter spent $11.7 billion of capital in 2025 — 21% of revenue — on a network upgrade to symmetrical multi-gigabit speeds and on subsidised rural line extensions [28]. After that capital and $5.04 billion of net interest [29], $22.7 billion of Adjusted EBITDA became $5.0 billion of free cash flow [30]. Capital expenditure and net interest alone absorb roughly 73 cents of every EBITDA dollar; cash taxes and working capital take most of the rest.
That is also why free cash flow is the volatile line in the chart while EBITDA is not. The 2023 drop to $3.5 billion and the 2025 recovery to $5.0 billion were driven by capex timing, working capital on mobile devices, and cash taxes — not by the operating business [31].
The balance sheet
Debt Principal ($B)
Listed Equity Value ($B)
EV / Adj. EBITDA (x)
FY2025 Free Cash Flow ($B)
Sources: debt principal at 31 March 2026 per the Q1 2026 results release [32]; free cash flow per the FY2025 Form 10-K [33]; equity value and multiple derived from the 22 July 2026 closing price and the 126,631,549 Class A shares outstanding reported in the FY2025 Form 10-K [34].
Charter's debt principal was $94.6 billion at the end of 2025 and $94.3 billion at the end of March 2026, against $517 million of cash and $4.6 billion of undrawn revolver [35] [36]. Net debt to trailing Adjusted EBITDA was 4.15 times, inside management's stated 4.0 to 4.5 times range [37].
There were 126,631,549 Class A shares outstanding at the end of 2025 [38], of which 4.3 million were bought back in the first quarter of 2026 for $963 million [39], at an average price of $225 a share [40]. At the 22 July 2026 close of $129.22, roughly 122 million remaining shares are worth about $15.8 billion. Advance/Newhouse Partnership holds exchangeable units representing an effective common interest of about 11%, which adds roughly $1.9 billion of economic equity outside the listed shares [41]. On those figures enterprise value is near $111 billion and debt is about 84% of it; the trailing multiple is roughly 4.9 times Adjusted EBITDA.
The equity's leverage to operating results follows from that ratio. With the equity at one-seventh of enterprise value, a 5% move in Adjusted EBITDA — about $1.1 billion — changes enterprise value by roughly $5.5 billion at a constant multiple, or about a third of the equity. The operating business is stable; the equity claim on it is not.
The maturity ladder
Source: FY2025 Annual Report (Form 10-K), Notes — Liquidity and Future Principal and Interest Payments [42].
There is no near-term wall. Only $1.06 billion of principal falls due in 2026 and $3.56 billion in 2027; $63.5 billion sits beyond 2030 [43]. The pressure is price, not date. Charter's fixed-rate book of $82.7 billion carries an average coupon of 5.07% [44]; in January 2026 the company issued $1.75 billion at 7.000% due 2033 and $1.25 billion at 7.375% due 2036, and used the proceeds to retire notes carrying 5.500% and 5.125% [45]. $31.1 billion of principal — a third of the book — comes due by 2030 [46]; refinanced at roughly two points higher, that adds on the order of $600 million to annual interest by 2030, or about 12% of FY2025 free cash flow.
The same repricing shows up in the debt's fair value. The $82.7 billion fixed-rate book was carried at a fair value of $73.7 billion at the end of 2025 [47]. Most of that $9.0 billion discount is the arithmetic of low coupons on very long paper against today's yields rather than a distress signal — but it is the same repricing seen from the other side.
What the equity has done
Source: CHTR daily closing prices, as reported; 2016–2025 are year-end closes, 2026 is the 22 July close.
The stock peaked at $821.01 on 2 September 2021 and closed at $129.22 on 22 July 2026 — a decline of 84%. It has fallen in five of the last six calendar years. The steepest single move was on 24 April 2026, when first-quarter results took the shares from $241.78 to $180.13 in a day, with a further slide to $129.22 over the following three months.
The buyback record is the other half of that arithmetic. Between the programme's start in September 2016 and the end of 2025, Charter repurchased about 179.7 million shares and Charter Holdings units for approximately $78.8 billion — an average of roughly $438 a share [48]. The whole listed equity is worth about $15.8 billion today. The defence is that the buybacks did what they were designed to do: basic weighted average shares fell from 183.7 million in FY2021 to 135.2 million in FY2025 [49] [50], and diluted earnings per share rose from $24.47 to $36.21 over the same period while net income barely moved [51] [52]. Both readings are true, and the tension between them belongs to a later chapter. What matters here is the shape it left: a business financed with far more debt than equity, and an equity whose value moves as a small residual on a much larger debt claim.
Two changes already in motion
Two structural events are close enough to matter to any current estimate.
The Cox transaction, agreed on 16 May 2025, has Cox Enterprises contribute Cox Communications' residential cable business to Charter Holdings and sell its commercial fibre and managed-IT and cloud businesses to Charter [53], with Charter funding $4.0 billion of cash consideration with debt and assuming roughly $12.6 billion of Cox net debt and finance leases [54]. Cox Enterprises would hold about 25.1% of the combined entity's diluted shares [55]. On the April 2026 call management said all federal and state approvals were in hand except California's, and that it was working towards a summer close [56]. Run-rate operating-expense synergies were put at at least $800 million, and the share count at close, as-converted and as-exchanged, at about 179 million [57]. Any per-share number computed on today's 122 million shares is therefore provisional.
The capital cycle is the second. Charter expects 2026 capex of about $11.4 billion, and management has said that once the network-evolution and rural-expansion programmes conclude, run-rate capital expenditure should fall below $8 billion a year — a reduction it put at more than $28 of free cash flow per share on the current count [58] [59]. Against a $129.22 share price, that one item is worth more than a fifth of the current price in annual cash flow. It is also a management projection about spending three years out, made while the same management guided weighted average cost of debt at 5.2% and run-rate annualised cash interest at $4.9 billion [60] — a figure that rises as the 5.07% book reprices toward 7%.
What this report examines
Charter is a mature, cash-generative network business whose operating results move slowly and whose equity moves much more, because the equity is a thin residual on top of $94 billion of debt. Both of the near-term swing factors are large and point in opposite directions: capital spending is set to fall by roughly $3.7 billion a year, and the cost of the debt is set to rise as a 5.07% book reprices at 7%.
This report examines whether Charter's free cash flow — rising as a multi-year capital programme ends, falling as low-coupon debt reprices — can stabilise a shrinking broadband base and reduce $94 billion of debt fast enough to leave value in an equity now worth about one-seventh of enterprise value.
Watch items that would move that read: the quarterly direction of internet customer net additions, currently minus 120,000; Adjusted EBITDA growth, currently minus 2.2% year over year; realised capital expenditure against the sub-$8 billion run-rate target; and the coupon on each refinancing against the 5.07% average now carried.
The strongest fact against a pessimistic reading is that the operating base has not broken: Adjusted EBITDA was $22.7 billion in 2025, up from $21.6 billion in 2022, and free cash flow rose in each of the last two years [61] [62]. The strongest fact against an optimistic one is that the first quarter of 2026 showed revenue down 1.0%, Adjusted EBITDA down 2.2% and free cash flow down 12.3% year over year, with internet losses running at double the prior-year rate [63] [64]. One quarter of stabilising broadband losses alongside the capex step-down would change the arithmetic materially; a second year of accelerating losses would change it the other way.
Limits on what is verifiable here. The corpus ends with the April 2026 quarter, so nothing after 24 April 2026 is sourced to a filing other than the share price. The run's forward-estimate feed is empty, so no consensus figures are used or implied; the 2028 capital expenditure and synergy numbers are management projections, cited as such. Enterprise value, the EV/EBITDA multiple and the equity value are derived from the cited share counts, debt balances and the 22 July 2026 closing price, not taken from a filing.
The Broadband Base
Charter's broadband customer count peaked at 30.59 million at the end of 2023 and has fallen every year since, to 29.56 million at March 2026 [1] [2]. For three years higher rates more than covered the lost units; this year they stopped, and the connectivity revenue that still grows now leans on the mobile line — a line priced for retention rather than standalone profit.
Rate and mix added $785 million to residential Internet revenue in 2025 but only $9 million in the first quarter of 2026 against $87 million of volume loss, tipping residential Internet revenue to a 1.3% decline, while the mobile line that offsets it grew on volume (+$714 million) and lost rate (-$35 million) at roughly $30 per line per month — a margin Charter has not disclosed since 2022, when Spectrum Mobile's $3,042 million of revenue sat against $3,385 million of direct cost, a $343 million deficit. [3] [4] [5] [6] [7] [8] [9].
Internet is 43% of revenue — $23.8 billion of $54.8 billion in 2025 [10] — and the largest single input to the cash flow that services the debt, so the direction of that rate line is a cash question: each 1% of residential Internet revenue is about $238 million a year.
The mobile line is doing its job on revenue. Mobile service revenue grew 15.1% in the first quarter of 2026 and total connectivity revenue — Internet plus mobile together — still rose 0.9%, with management citing materially lower broadband churn where a mobile line is attached [11] [12] [13]. Whether it is doing that job on profit is a question the filings no longer answer: the 0.9% is built from more mobile lines sold at roughly $30 a month, a retention price, on a product whose last disclosed standalone result was a $343 million direct-cost deficit in 2022 [14]. The connectivity cushion is a firmer signal of revenue than of profit.
The shape of the decline
Sources: FY2022 Form 10-K [15], FY2023 Form 10-K [16], FY2024 Form 10-K [17] and FY2025 Form 10-K [18]; Q1 2026 earnings release [19]. Residential customers only; the totals quoted in the text include small business.
The 2024 loss of 510,000 residential customers has a partial one-off explanation: the FCC's Affordable Connectivity Program ended in the second quarter of 2024, and Charter attributes a share of that year's disconnects to it [20]. The 2025 loss of 393,000 does not, and the first quarter of 2026 was worse than the first quarter of 2025 — 120,000 total Internet customers lost against 59,000 [21].
Penetration of the footprint fell from 56.7% at December 2024 to 54.0% at March 2026 [22] [23], but two-thirds of that move is the denominator. Estimated passings grew from 56.86 million to 58.40 million during 2025 [24]; held at the 2024 footprint, the 2025 relationship count of 31.85 million would represent 56.0% penetration rather than the reported 54.5% — a decline of 0.7 points, not 2.2. Charter is building into its own penetration ratio, which is a choice, not a symptom.
Two disclosure changes sit inside this series and should be handled with care. In the fourth quarter of 2024 Charter restated its December 2023 passings from 56.99 million to 55.32 million [25]. Then, in the fourth quarter of 2025, it revised customer relationship statistics "to include all mobile customers, including mobile-only customers" [26]. Prior periods were restated, so the series is internally consistent, but the effect on the level is material: December 2024 relationships were reported as 31.47 million in January 2025 [27] and as 32.21 million a year later [28], a difference of 741,000 customers who take a phone line and no wire. The headline relationship count is no longer a proxy for broadband households. Internet customers are the clean series, and that is the series used throughout this chapter.
Where the customers went
Three national wireless carriers now sell home broadband over their cell networks, and their combined book grew by about four million connections in 2025 — roughly three times the broadband customers the four listed cable operators lost between them.
Sources: T-Mobile FY2025 Form 10-K, customer metrics [29] and FY2024 Form 10-K [30]; Verizon FY2025 Form 10-K [31] and FY2024 Form 10-K [32]; AT&T FY2025 Form 10-K [33]; Comcast FY2025 Form 10-K [34]; Altice USA FY2025 Form 10-K [35]; Cable One FY2025 Form 10-K [36]; Charter Q4 2025 earnings release [37]. T-Mobile's figure combines postpaid and prepaid 5G broadband. Comcast's change is reported net losses; its year-end level also reflects roughly 124,000 business customers added through the Nitel acquisition and excluded from net losses.
The arithmetic does not prove causation — household formation, copper displacement and fibre all sit inside the same gap — but it establishes scale. Fixed wireless is no longer a rounding error against a 30-million-customer base, and its fastest-growing entrant is the newest: AT&T added 875,000 Internet Air connections in 2025, more than doubling its book [38]. Management's own reading matches. Asked in April 2025 whether fibre overbuilders were splitting his markets, Chris Winfrey said the fibre effect "has been consistent and steady" and that the real drivers were "mobile substitution and the introduction of a new low-end competitor with cell phone Internet" [39]. A year later the framing was unchanged, and sharper: the problem is "a top-of-funnel issue", with churn "at historical lows" and yield at the point of sale "as strong as ever" [40].
Fibre overlap is the second front, and Charter's own disclosure of it is harder to read than it looks. In the 2021 Form 10-K, AT&T, Frontier and Verizon competed in approximately 34%, 9% and 5% of operating areas at speeds of at least 25 Mbps [41]; by 2023 that was 35%, 11% and 6% on the same definition [42]. The 2024 filing raised the threshold to the FCC's 100 Mbps standard, and the same three names fell to 25%, 9% and 6% [43]. In 2025 Frontier disappears from the sentence entirely and the figures are AT&T 27% and Verizon 16% [44]. That jump is a merger, not a construction programme: Verizon completed its acquisition of Frontier on 20 January 2026 [45], and the 2024 figures of 9% plus 6% land almost exactly on the 2025 figure of 16%. The change in the level of overbuild is small; the change is that two competitors became one, with one balance sheet and one converged offer.
No chart is offered for that series, because the 25 Mbps and 100 Mbps definitions are not the same measurement and plotting them together would suggest a fall in overbuild that did not happen.
Price against volume
Charter publishes its own decomposition of residential Internet revenue into rate-and-mix and volume. For three years it told a consistent story: rate covered the units.
Sources: derived from Charter's own revenue bridges — FY2023 Form 10-K [46], FY2024 Form 10-K [47], FY2025 Form 10-K [48] and Q1 2026 Form 10-Q [49]. Each contribution is expressed as a percentage of the prior period's residential Internet revenue. Q1 2026 is a quarterly year-over-year comparison, the others annual.
In 2025 rate and mix added $785 million while volume subtracted $380 million, for net growth of $405 million on a $23.36 billion base [50] — the strongest rate contribution of the four periods shown. In the first quarter of 2026 the rate line collapsed to $9 million against $87 million of volume loss, and residential Internet revenue fell 1.3% year over year [51] [52]. At the 2025 run rate, each 1% of residential Internet revenue is about $238 million a year.
Three qualifications belong in the same breath. First, one quarter is one quarter. Second, Charter attributes even that $9 million partly to "a favourable change in bundled revenue allocation" [53] — allocation between the Internet, mobile and video lines moves revenue around without changing what the household pays, which cuts both ways on the FY2025 figure too. Third, and most substantively, the household is still spending more: mobile service revenue grew 15.1% in the quarter, and connectivity revenue — Internet plus mobile together — still rose 0.9% [54]. What has changed is the rate of that offset: connectivity revenue grew 4.1% in 2025 [55] and 0.9% in the first quarter of 2026.
Where the price competition is visible is in what Charter now pays to acquire a household. In the first quarter of 2026 it launched a guarantee of $1,000 of first-year savings to customers who take Spectrum Internet and move two or more mobile lines from Verizon, AT&T or T-Mobile [56]. Headline broadband pricing holds; the discount is routed through the bundle.
What the capital is buying
Roughly half of Charter's capital budget goes to the footprint rather than to the existing customer.
Sources: FY2023 Form 10-K, capital expenditure table [57]; FY2025 Form 10-K, capital expenditure table [58]. Upgrade/rebuild is the category that contains the network evolution initiative; all other combines customer premise equipment, scalable infrastructure and support capital.
The network evolution initiative — symmetrical and multi-gigabit speeds across the whole footprint — sits inside upgrade/rebuild, which was $1.94 billion in 2025 [59]. Half the network is due to be upgraded by the end of 2026, with completion in 2027 [60] [61]. The subsidised rural build is the larger line: $2.20 billion in 2025 alone and $7.7 billion since 2022, activating about 1.3 million passings towards a target of more than 1.7 million, against more than $2 billion of government support awarded [62] [63].
The rural build works, and it is masking what happens elsewhere. Charter added 39,000, 47,000, 52,000 and 46,000 customer relationships inside the subsidised rural footprint through the four quarters of 2025 [64] [65] [66] [67] — 184,000 in total, against a company-wide fall of 368,000 [68]. The established footprint therefore lost roughly 552,000 relationships in 2025, half again the headline. That gap will not close by itself: rural passings growth is guided to 450,000 in 2026, described by management as the last large build year [69].
What the evidence supports
Charter's competitive position is narrow rather than wide, and the numbers that establish it are relative, not absolute. Against the listed cable operators it is the best of a losing set: Charter's broadband base fell 1.3% in 2025, Comcast's 2.2%, Altice USA's 4.7% and Cable One's residential data base 5.8% [70] [71] [72] [73]. It also penetrates its footprint far more deeply — 54.5% of passings at the end of 2025 against Comcast's 47.6% of homes and businesses passed [74] [75], though the two measures are defined by each company and are not strictly comparable.
What that advantage does not extend to, on this evidence, is pricing power. A moat should be visible in the ability to raise price faster than units decline; in the first quarter of 2026 it was not. The read here is that Charter's capital programme is aimed at the part of the problem that is already working. Retention is not the constraint — management describes churn at historical lows and better still where a mobile or video product is attached [76] [77] — and a faster network is a retention and pricing asset. Acquisition is the constraint, and a symmetrical multi-gigabit upgrade does not obviously restore a household's willingness to consider Charter when its phone already carries a home broadband offer.
The strongest fact against that read is that Charter's losses are concentrated in gross additions rather than disconnects, which is exactly the pattern one would expect from a shrinking pool of movers rather than from a product deficit: management points to a muted housing environment, slow household formation and low move rates alongside the new competition [78] [79]. If that is right, the base stabilises when housing turnover normalises, without Charter doing anything differently, and the network upgrade arrives in time to monetise it. That claim cannot be tested from this corpus — Charter publishes no gross-add or churn figures, only its characterisation of them, and no share data for its fibre-overlap markets beyond the assertion that its share there remains above the competition [80].
Two observable things would change the read. Residential Internet revenue returning to growth with a rate contribution back above 2% would show the pricing engine restarting and make the first quarter of 2026 a blip. Conversely, a second and third quarter in which rate contributes near zero while volume subtracts 1.5% would establish that the household's broadband dollar is now falling in both directions at once — and at that point the relevant arithmetic is not the customer count but the $4.9 billion run-rate annual cash interest that a 43%-of-revenue line has to keep covering [81].
Mobile Economics
Spectrum Mobile is the only connectivity line Charter still grows — mobile service revenue rose 22% to $3,762 million in 2025 [1] and 15.1% in the first quarter of 2026, while broadband revenue turned negative [2]. It runs on Verizon's network, carries almost no capital, and management says it is profitable [3]. The filings no longer let anyone check that claim: Charter stopped disclosing mobile's direct cost line after 2022, the last year it showed one — a year in which the product ran a $343 million deficit [4].
The only line still growing
Mobile lines more than tripled in four years, from 3.56 million at the end of 2021 to 11.77 million at the end of 2025, and added another 368,000 in the first quarter of 2026 [5] [6]. It is doing this while consuming almost no capital: mobile capital expenditure was $267 million in 2025, roughly 2% of Charter's $11,659 million total, because as a mobile virtual network operator Charter rents Verizon's radio network rather than building its own [7] [8].
Mobile Service Revenue 2025 ($M)
▲ 22.0% YoY
Mobile Lines, year-end 2025 (000s)
Mobile Capex 2025 ($M)
Source: FY2025 Form 10-K, customer statistics and capital-expenditure tables [9] [10].
Source: FY2021–FY2025 Forms 10-K, customer statistics [11] [12].
That growth is what keeps connectivity revenue positive as the broadband engine stalls, the cushion examined in The Broadband Base. The filings no longer settle whether those lines earn a standalone profit or defend the broadband relationship at a thin margin; the sections below set out what the disclosure shows and where it stops.
The margin the filings used to show
Through 2022, Charter reported Spectrum Mobile as a discrete revenue line and a discrete cost line. On that disclosure, mobile lost money every year at the direct level — before any allocation of overhead, marketing, or the broadband network it rides on:
Source: FY2022 Form 10-K, revenue by product and operating-cost detail [13] [14]. Revenue and cost are the full mobile lines, including equipment.
The deficit was narrowing but persistent: negative $401 million in 2020, negative $311 million in 2021, negative $343 million in 2022 [15]. This is the ordinary economics of a scaling MVNO: acquisition subsidies (free or discounted phones, and Charter's Phone Balance Buyout programme that pays off a switcher's balance at a competitor) and wholesale payments to Verizon ran ahead of a customer base still being built [16]. The reported cost also mixed in equipment sold at or near cost, so the service-only loss was smaller than the headline. But the direction was clear, and it was visible.
What the 2023 reclassification removed
With the 2023 Form 10-K, Charter re-cut both halves of that arithmetic. Mobile service revenue moved into the residential connectivity block; mobile device revenue moved into "Other" revenue alongside processing fees and home shopping [17]. On the cost side, the discrete "Mobile" line disappeared entirely, folded into a new "Other costs of revenue" bucket that also carries franchise fees, produced content, and the Los Angeles Lakers and Dodgers rights [18] [19].
Source: comparison of the FY2022 and FY2023–FY2025 Forms 10-K, revenue-by-product and operating-cost presentations [20] [21].
The reclassification is not itself evidence of anything hidden — Charter reports a single operating segment, and the new taxonomy is defensible. But its effect is that mobile's standalone profitability, the figure an investor would most want to check, can no longer be computed from the filings. What replaces the number is management's word. On the fourth-quarter 2025 call, Christopher Winfrey stated it plainly: "Mobile is profitable, it will continue to grow, and improves broadband churn meaningfully" [22].
The economic case behind that claim is real and specific: "Nearly 90% of Spectrum mobile traffic goes over our network already," Winfrey said — Charter's own WiFi and, increasingly, CBRS spectrum — so only a minority of usage incurs a Verizon wholesale charge [23]. Scale spreads the fixed cost of running the MVNO, and offload keeps the variable cost down. Both forces push the same direction the 2020–2022 deficit was already travelling, so a swing to a positive service-level margin by 2025 is entirely plausible. It is simply not disclosed, and the size of the profit — whether mobile is a rounding error or a genuine second engine — is unknowable from the filings.
Volume, not price
What the filings do show is that the growth is volume, not price. Charter's own bridge attributes the 2025 increase in residential mobile service revenue to $714 million from more lines against a $35 million decline from rate [24]. Service revenue per line has held at roughly $30 a month and is edging down, well below the $40–$50 a standalone national carrier collects.
Source: derived from mobile service revenue and average total mobile lines, FY2023–FY2025 Forms 10-K [25] [26].
Low pricing is deliberate. Charter markets mobile as the mechanism that lets a bundled household "save customers over $1,000 in a single year," and in the first quarter of 2026 it launched a $1,000 first-year savings guarantee as the headline of its convergence pitch [27]. The Anytime Upgrade programme lets customers replace devices without the usual wait times or fees, and the Phone Balance Buyout removes the switching cost of a competitor's unpaid device balance [28]. These are the tools of a retention product, priced to keep broadband customers, not of a standalone profit maximiser. That is consistent with the churn benefit management cites and with the low ARPU; it is also consistent with a thin service margin.
The device-financing book underneath
There is a second, quieter dimension to mobile: Charter fronts its customers' phones. Devices are sold on interest-free monthly instalment plans, so Charter recognises the equipment revenue and cost up front but collects the cash over two to three years, carrying the balance as a receivable [29]. Those receivables reached about $2.2 billion of unpaid principal at the end of 2025, funded through a bankruptcy-remote securitisation vehicle — the Equipment Installment Plan Financing Facility — carrying $1.4 billion of debt at a 5.14% rate [30] [31].
EIP Receivables, unpaid principal ($B)
EIP Financing Facility drawn ($B)
EIP Facility rate
Source: FY2025 Form 10-K, Note 10 and equipment-instalment-plan disclosures [32] [33].
This is a modest but real financing operation attached to a connectivity business, and it cuts two ways for cash flow. As the base grew, the mobile-device working-capital swing added about $398 million to 2025 free cash flow — a benefit that fades and can reverse when line growth slows (Cash Conversion). It also means a slice of Charter's balance sheet is now a consumer-device lending book, a category of risk that did not exist five years ago and that the single-segment presentation leaves un-sized beyond the receivable and its allowance.
What the evidence supports
Mobile is asset-light, fast-growing, and the clearest source of the low churn that keeps Charter's broadband base from shrinking faster. Management's assertion that it is now profitable is plausible on the offload-and-scale economics, and the pre-2023 trajectory was already closing the gap. Two facts sit against taking that as settled: the last disclosed direct margin, in 2022, was still negative $343 million, and Charter removed the line that would let an outsider confirm the turn. The revenue is priced as retention — about $30 a line and falling on rate — which fits a product whose job is to defend the broadband relationship more than to earn a standalone return.
The read here is that mobile is best understood as a churn-and-value engine that has probably crossed into positive service margin, not as a proven profit centre of known size. What would change it is disclosure: a segment margin, a return to a discrete mobile cost line, or the wholesale terms of the Verizon MVNO — none of which the current filings provide, and each of which would move the assessment materially in either direction. The pending business MVNO with T-Mobile, launching in 2026, adds a second wholesale relationship whose economics are equally undisclosed [34].
Cash Conversion
Charter turns a high share of its earnings into cash, but the rate has swung with its build cycle: free cash flow ran to 42% of Adjusted EBITDA in 2021, fell to 16% in 2023 as capital spending peaked, and has recovered to 22% in 2025. The build cycle is now inverting, and two forces pull the resulting cash in opposite directions — the capital programme rolling off, and the debt stack repricing as it matures — with the first much the larger through 2030. Charter's guided capex fall from about $11.7 billion in 2025 toward a sub-$8 billion run-rate frees roughly $3.7-3.9 billion of gross annual free cash flow while only about $31 billion of the $94.6 billion debt stack — a third, 87% of it fixed at 5.07% — matures through 2030, so repricing that tranche adds only about $0.6 billion of interest; but the 2025 free-cash-flow gain leaned on a $669 million cash-tax decrease from restored 100% bonus depreciation, a shield that shrinks as the capital budget itself falls, so cash taxes normalise upward against the capex benefit. [1] [2] [3] [4] [5] [6]
Netted against the gross figure, the uplift is materially smaller than the headline capex cut. Management frames the 2025-to-2028 reduction as more than $28 of free cash flow per share on the current count [7], and the gross relief is roughly $3.7 billion against the $5.0 billion Charter generated in all of 2025. But the 2025 conversion gain was mostly non-operating — of the $747 million free-cash-flow rise, only $139 million came from higher Adjusted EBITDA [8] — and as the bonus-depreciation shield unwinds, cash taxes normalise upward by an estimated $1.0 to $1.5 billion while repricing adds about $0.6 billion, so the net uplift runs well below the gross. The relief still clearly outweighs the repricing through 2030 — roughly six times the incremental interest — but it converts a business whose Adjusted EBITDA has been flat for five years, so the cash grows faster than the franchise beneath it.
Adjusted EBITDA (FY2025)
Free Cash Flow (FY2025)
FCF / Adjusted EBITDA
Run-rate Cash Interest
Sources: FY2025 Form 10-K, Adjusted EBITDA and free-cash-flow reconciliation [9]; Q1 2026 earnings call, cash-interest run-rate [10].
The Business and Balance Sheet chapter established the destination — roughly $94.6 billion of debt against listed equity worth about a seventh of enterprise value — and The Broadband Base tested whether the largest revenue line still grows. This chapter sits between them: it follows each dollar of Adjusted EBITDA to the cash that is actually left for debt reduction and shareholders, and asks what happens to that cash as the capital cycle turns.
How EBITDA becomes cash
Charter's reported free cash flow is a narrow figure: net cash from operating activities, less capital expenditures and the change in accrued capital costs [11]. In 2025 that produced $5,004 million from $22,708 million of Adjusted EBITDA — about 22 cents on the EBITDA dollar [12]. The two claims that consume the rest are visible in the multi-year record: capital expenditure and cash interest.
Sources: FY2025 Form 10-K [13]; FY2023 Form 10-K [14]; FY2021 Form 10-K [15].
Adjusted EBITDA barely moved across five years — $20.6 billion in 2021 to $22.7 billion in 2025 [16] [17] — while free cash flow more than halved from $8.68 billion to a $3.49 billion trough in 2023 and back to $5.00 billion [18] [19]. The swing was almost entirely capital expenditure, which rose from $7.6 billion to $11.7 billion over the same period [20] [21]. Charter's free cash flow, in other words, is a leveraged read on its build cycle: with EBITDA flat, the direction of capex sets the direction of cash.
The 2025 recovery leaned on non-operating items. Of the $747 million free-cash-flow rise, the larger contributors were a $669 million decline in cash taxes — driven by the July 2025 One Big Beautiful Bill Act restoring 100% bonus depreciation — and $398 million of favourable mobile-device working capital, partly offset by higher capital expenditure [22]. Cash taxes fell to under $900 million in 2025 and are guided to $500–800 million in 2026 [23]. Bonus depreciation is a timing benefit that reverses as the asset base matures, so part of the 2025 conversion improvement is borrowed from later years rather than earned operationally.
The capex cliff
The capital cycle's direction is about to invert. Capital expenditure is guided to approximately $11.4 billion in 2026, still elevated by the network-evolution upgrade and the subsidised rural build [24]. Management states that once those programmes conclude, run-rate capital expenditure falls below $8 billion a year, which it expects to reach by 2028 [25].
Sources: FY2025 Form 10-K, actuals [26]; Q1 2026 results, 2026 guidance [27]; Q4 2025 call, sub-$8 billion run-rate (2028e is management's own approximate mid-point) [28].
The interest ramp
Charter's debt is where the market's anxiety concentrates, and the concern is prospective rather than present. Net interest expense has not been climbing: it was $5,042 million in 2025, below $5,229 million in 2024, and cash paid for interest fell to $4,983 million from $5,334 million [29] [30]. The stack is long-dated and about 87% fixed at low coupons [31]; its full maturity ladder, fixed-rate book and fair-value discount are set out in Business and Balance Sheet. What matters for cash conversion is how fast that book reprices.
The repricing is already visible at the margin. In September 2025 Charter issued 5.850% notes due 2035 and 6.700% notes due 2055; in January 2026 it issued 7.000% notes due 2033 and 7.375% notes due 2036, both at par, and used the proceeds partly to call 5.500% notes due 2026 and 5.125% notes due 2027 [32]. Each dollar rolled from the low-5% coupons into the new 7%-plus paper adds roughly 175 to 225 basis points of cash interest.
The maturities are back-loaded, so the exposure arrives slowly. Only $1.06 billion of principal falls due in 2026, and cumulative maturities through 2030 total about $31 billion — a third of the stack — with the remaining $63.5 billion maturing after 2030 [33]. If that $31 billion reprices from roughly 5% to 7% by 2030 and rates hold there, the added cash interest is on the order of $0.6 billion a year — about one-sixth of the $3.7 billion capex tailwind arriving over the same window. The bulk of the repricing exposure lands in the 2030s, not the thesis window. Management's own shorthand — a weighted cost of debt "at an attractive 5.2%" and cash interest running at $4.9 billion — reflects a stack that reprices slowly because it is long-dated and mostly fixed [34].
Where the cash goes
A rising free-cash-flow figure only reduces the $94.6 billion debt if it is used to. It has not been. In 2025 Charter spent $5,132 million on treasury-stock purchases — slightly more than its $5,004 million of free cash flow — while gross borrowings of $15,485 million against $14,797 million of repayments left total debt principal roughly flat [35]. Deleveraging to date has therefore come from EBITDA inching up against a stable debt balance, not from paying debt down.
Sources: repurchases and cash flows from the FY2021 [36], FY2023 [37] and FY2025 [38] Forms 10-K.
That posture is now shifting under shareholder pressure. Charter had run a 4.0–4.5x leverage target; when it announced the Cox transaction it committed to the midpoint of a 3.5–4.0x range, and on the Q4 2025 call it moved the post-transaction target to the low end of a new 3.5–3.75x band, citing shareholders' "preference for less leverage during a lower growth period" and a capacity to cut leverage by up to half a turn a year [39]. Net debt to trailing Adjusted EBITDA stood at 4.15x at March 2026 [40]. The same call kept the commitment to "significant ongoing capital returns to shareholders," so the coming free-cash-flow inflection has to fund debt reduction and buybacks from one pool — which bounds the pace of either [41].
Management is unusually candid about what the market is pricing. On the Q4 2025 call it described the task as overcoming "the perception of negative perpetuity growth implied in our valuation today" [42]; on the Q1 2026 call it argued that substituting the 2028 capex run-rate into consensus 2026 free cash flow would imply a free-cash-flow multiple of about 3.8x and a yield above 25% [43]. That is management's bull case stated in its own numbers; it rests on holding Adjusted EBITDA roughly flat while capex falls, which is exactly the assumption The Broadband Base put in question. It also predates the pro-forma share count: the Cox and Liberty Broadband transactions lift the standalone count to about 179 million shares (The Cox Combination), so per-share cash-flow gains are diluted before they arrive [44].
The evidence supports a measured read: the cash-conversion inflection is real and large enough to be the strongest structural support for the investment case, and the debt-repricing headwind is genuine but slow enough not to swamp it before 2030. The read is most sensitive to Adjusted EBITDA, not to the coupon on the debt: if EBITDA does not hold, a falling capex line converts a shrinking business into cash more efficiently without changing that it is shrinking. What would change the read in the company's favour is Adjusted EBITDA re-accelerating, or free cash flow visibly directed to retiring principal rather than to buybacks; what would change it against is long rates staying near 7% into the 2030s as the $63.5 billion long-dated tranche comes due.
Financials and Estimates
Charter's reported numbers are strikingly steady. Revenue has held in a $54–55 billion band for four years, Adjusted EBITDA has edged up to $22.7 billion, and diluted EPS has climbed to $36.21 — mostly through buybacks, not profit growth. The balance sheet carries $94.6 billion of debt against $16.1 billion of book equity that is entirely intangible. Management guides to slight 2026 EBITDA growth and capital spending falling toward sub-$8 billion by 2028. No full sell-side consensus table exists in this run; the forward view below is built from management's own guidance.
FY2025 Revenue ($B)
Adjusted EBITDA ($B)
Net Income to Charter ($B)
Diluted EPS
Free Cash Flow ($B)
Net Debt / EBITDA (x)
Sources: Consolidated Statements of Operations [1]; Adjusted EBITDA and free cash flow reconciliation [2]; leverage from the Q1 2026 earnings call [3].
The three-year income statement
Over 2023–2025 the top line barely moved: $54,607 million, $55,085 million, $54,774 million — a compound rate near zero [4]. Income from operations sat between $12.6 billion and $13.1 billion, and net income attributable to shareholders held between $4.6 billion and $5.1 billion across all three years [5]. This is a mature, cash-generative operator whose reported profit has flat-lined.
Source: Consolidated Statements of Operations, FY2025 Form 10-K, for 2023–2025 [6]; 2021–2022 from prior filings as reported.
Margins have been stable to slightly improving: the operating margin ran 23.0%, 23.8% and 23.6% across 2023–2025, and the Adjusted EBITDA margin was roughly 41% of revenue [7] [8]. With revenue flat, cost discipline has held profit steady.
Per-share growth is a buyback story
Diluted EPS rose from $29.99 to $36.21 between 2023 and 2025 — about 10% a year — while net income attributable to shareholders actually fell slightly [9]. The bridge is the share count: the basic weighted average fell from 149.2 million to 135.2 million shares over the same span [10]. All of the per-share progress has come from spending cash to retire stock, a point developed in Cash Conversion.
Source: Consolidated Statements of Operations, FY2025 Form 10-K [11].
Cash flow: EBITDA is flat, free cash flow tracks capex
Adjusted EBITDA rose only modestly — $21,616 million (2022), $21,894 million (2023), $22,569 million (2024), $22,708 million (2025) [12] [13]. Reported free cash flow, by contrast, swung with the capital programme — $6,102 million, $3,490 million, $4,257 million, $5,004 million — because operating cash flow is steady near $14–16 billion while capex is not [14] [15].
Source: Consolidated Statements of Cash Flows [16]; free cash flow per company definition (operating cash flow less capex and the change in accrued capex) [17] [18].
One caveat on quality: the 2025 free cash flow rise of $747 million came mostly from a $669 million drop in cash taxes (100% bonus depreciation restored under the 2025 tax act, a timing benefit) and a $398 million mobile-device working-capital inflow; higher EBITDA contributed just $139 million [19]. Two of those three drivers reverse over time.
The balance sheet and the solvency question
For a reader who wants the chance of bankruptcy near zero, the balance sheet needs its own look. Total assets were $154.2 billion at year-end 2025, but $97.2 billion of that is intangible — $67.5 billion of cable franchises, $29.7 billion of goodwill — against $16.1 billion of book equity [20]. Goodwill alone exceeds book equity, so there is no tangible-asset floor beneath the stock; the equity's worth rests on the franchise cash flows, not on assets that could be sold in a wind-down. Book equity also flatters the picture — an accumulated deficit of $5.4 billion sits against $21.4 billion of paid-in capital, the residue of years of buybacks charged against equity [21].
Solvency, though, is a question of coverage and timing, and on both the near-term reading is comfortable. Adjusted EBITDA of $22.7 billion covers net interest expense of $5.0 billion about 4.5 times, and covers the $4.9 billion run-rate cash interest about 4.6 times [22] [23]. The debt is 87% fixed at a 5.07% average rate, and the maturity ladder is light for years: only about $1.1 billion falls due in 2026 and roughly $31 billion — a third of the stack — matures through 2030, leaving $63.5 billion beyond [24].
Source: interest-rate-risk table (fixed plus variable principal by maturity), FY2025 Form 10-K [25]. The 2031 bar aggregates all maturities thereafter.
The credit market's own verdict points the same way: the $94.6 billion of principal is carried at roughly $85.5 billion of fair value — about a 10% discount that reflects higher market rates since issuance, not distress pricing [26]. Charter also met the CCO Holdings leverage tests with no indenture default at year-end [27].
On the evidence, near-term default risk is low: a subscription cash-flow base covers cash interest more than four times, most of the debt is fixed and long-dated, and no meaningful maturity wall arrives before 2030. The counterweight is that leverage is high in absolute terms — net debt near 4.15x EBITDA and reported debt-to-equity close to 5.9x — so the coverage cushion narrows if EBITDA turns down rather than holding. The near-term risk to the equity is dilution of a thin residual; on this evidence, insolvency is not the threat.
The forward view
The reader's standing request for forward estimates runs into a data gap worth stating plainly: this run's analyst-estimate feed contains no forward revenue, EBITDA or free-cash-flow numbers, and the external research provider was unavailable, so a sell-side consensus table cannot be assembled here. What can be sourced is management's own guidance, which is specific, and the handful of consensus data points that do exist.
Management's guided markers point to a steady 2026 and a step-change by 2028:
Sources: Q4 2025 earnings call — 2026 capex, slight EBITDA growth [28]; cash taxes, sub-$8bn run-rate capex, cash interest, leverage target [29]; post-close share count [30].
Capex is the largest movable input to forward free cash flow. Management expects spending to fall from about $11.7 billion in 2025 to below $8 billion by 2028, a reduction it frames as worth over $28 of free cash flow per share on the current share count [31]. Two offsets sit against that tailwind and neither is quantified in the corpus: cash taxes normalise upward as bonus depreciation is consumed, and the 5.07% debt stack reprices toward the ~7% coupons now being issued as it matures — the timing and netting of both are worked through in Cash Conversion.
What the consensus that exists is saying
The published rating split is no strong buys, 5 buys, 11 holds, 3 sells and 2 strong sells, with a mean 12-month target price of $209.94 — about 62% above the 22 July 2026 close of $129.22. The forward price-to-earnings multiple sits near 3.1x, which at that price implies a forward EPS around $42, consistent with continued share-count reduction rather than net-income growth.
Price (22 Jul 2026)
Mean Analyst Target
Forward P/E (x)
Source: consensus of covering analysts and company market data, as reported (no backing filing page); price per market close.
Whether that low multiple is cheap or a fair mark on a base that is not growing is the valuation question — weighed against the conditions it depends on, that Adjusted EBITDA holds while the subscriber base shrinks and that the capex relief reaches the equity rather than being consumed by taxes and interest — in Scenarios and Watch Items.
The forward picture is missing a full consensus set — 2026–2028 revenue, EBITDA and free-cash-flow estimates are not in this run, and management guidance, however specific, is the company's own view. Any independent verdict on the forward numbers should be revisited once external consensus can be sourced.
Ownership and Control
Charter is not a founder-run company. It is controlled through a 2015 stockholders agreement by two strategic families — Liberty Broadband, John Malone's vehicle, at 29.1% of the shares, and the Newhouse family's Advance/Newhouse (A/N) at 13.2% — while all directors and officers together hold about 1.1%. That control is being rebuilt: Liberty is merging into Charter and its three directors resign, and Cox Enterprises enters as the new anchor holder with the chairmanship. Alignment exists — a chief-executive option grant hurdled at $564 against a $129 stock, and directors buying after the April 2026 crash — but it is modest at the management level.
Liberty Broadband
Advance/Newhouse
All Directors & Officers
CEO Pay FY2025 ($M)
Source: Charter 2026 Proxy Statement (DEF 14A), beneficial ownership as of 20 February 2026 and Summary Compensation Table, as reported.
For a reader who prizes owner-operators with capital at risk, Charter is an unusual case: the concentration is real, but it sits with two long-horizon holders who put in businesses, not the managers who run it day to day. Whether that control is being handed to owners aligned with outside shareholders or simply reshuffled bears directly on the choice between paying down debt and buying back stock (Cash Conversion).
Two families hold the shares; management holds very little
Charter's register is unusually concentrated for a company its size. Liberty Broadband owns 41.0 million shares (29.07%) and A/N 18.6 million (13.21%) — a combined 42.3% — against an index-fund float and a single large active holder, Dodge & Cox, at 10.34%. The entire board and executive team together own 1.10%.
Source: Charter 2026 Proxy Statement (DEF 14A), Certain Beneficial Owners, based on 141,178,369 shares outstanding on an as-exchanged basis as of 20 February 2026, as reported.
The two families' influence runs well beyond the raw stakes. Under the Second Amended and Restated Stockholders Agreement of 23 May 2015 — struck when Charter absorbed Time Warner Cable and Bright House — the board is fixed at thirteen, of whom Liberty Broadband designates up to three and A/N up to two, with the remaining eight independent of both [1]. Their voting is capped and subject to standstills, and each family places a designee on the key committees while a majority of every committee stays independent [2]. This is control by contract layered on top of ownership: two holders whose combined 42% would ordinarily dominate a shareholder vote instead operate inside negotiated caps, board seats, and transfer limits.
The practical read for skin-in-the-game is two-sided. The good part: the people setting strategy answer to owners with decades-long horizons and tens of billions at stake, not to a quarterly float. The limiting part: management itself owns barely 1%, so the alignment the reader is buying is the families', not the operators' — and the families' interests and the outside shareholders' need not coincide, most visibly on how aggressively to return cash versus cut debt.
The control structure is being rebuilt
The register recorded above is a snapshot of a structure mid-transition. Two moves are underway at once.
Liberty Broadband is being absorbed and, in the meantime, bought out monthly. Under the November 2024 merger agreement, each Liberty Broadband share converts into 0.236 of a Charter share [3], folding Liberty — whose principal asset is approximately 41.5 million Charter shares — back into the company it part-owns [4]. While the deal is pending, Charter buys Liberty stock back every month on a contractual formula that steadily reduces the stake, sending the proceeds to repay Liberty's own debt while exempting Liberty from the ownership cap its shrinking share count would otherwise breach [5]. The monthly repurchase amounts and their claim on Charter's buyback capacity are set out in Cash Conversion. The monthly Form 4s bear this out: Liberty sold Charter between 246,000 and 485,000 shares in each of the eight months to January 2026 — a contractual unwind of Charter's largest holder rather than open-market discretion.
Cox Enterprises is arriving as the new anchor. In exchange for a cash-and-debt consideration whose economics are set out in The Cox Combination, Cox Enterprises will become one of the combined company's two controlling holders. On governance, Cox's chairman Alex Taylor becomes Charter's chairman, Cox gains the right to nominate two directors, A/N keeps its two, and the three Liberty designees resign; a new stockholders agreement adds preemptive rights, fresh voting caps, and required participation in future buybacks [6]. Charter's own filing states the effect plainly: Liberty Broadband loses its governance rights, A/N's are modified, and Cox Enterprises receives new ones [7].
The net effect is a change of anchor tenant, not a move to a dispersed shareholder base. Control passes from Malone's Liberty to a pairing of the Cox family — a 127-year-old private business contributing its own cable systems — and the Newhouse family's A/N. Both are strategic, family-controlled holders of the kind this reader tends to favour, and both take their consideration substantially in Charter equity and stay on the board, which keeps their incentives pointed at the long-term share price. The reservation is that the same concentrated ownership that supplies patience also entrenches a capital-allocation preference the outside holder cannot easily overrule — and the leverage target has already migrated down under exactly that shareholder pressure (Cash Conversion).
Pay is front-loaded, performance-hurdled, and recently softened
Charter's chief executive, Christopher Winfrey — a 25-year company insider who rose through the CFO and COO seats — is paid in a way that looks, at first, strongly aligned. His reported compensation is dominated by a single 2023 grant: $89.1 million that year, of which about $83.7 million was equity, against roughly $5.8 million in 2024 and $6.5 million in 2025 once the mega-grant was in place.
Source: Charter 2026 Proxy Statement (DEF 14A), Summary Compensation Table; equity is the sum of stock and option awards, as reported.
That 2023 Performance Equity Program is the alignment story. Winfrey's target award was $85.0 million, delivered 90% in stock options that vest over five years, and — because he had already earned through the 2016 program's hurdles — the lowest stock-price hurdle on the new grant is $564, set against a February 2023 reference price of $396.94. Charter Class A last traded near $129. On that basis the grant that makes up the bulk of his pay is worth nothing unless the stock roughly quadruples: a genuinely high bar, and a genuinely large amount of upside-only exposure. Directors and the CEO have also put personal cash in on the way down — Mauricio Ramos bought 9,929 shares at $140.93 in May 2026, and Winfrey, Wade Davis and Balan Nair each bought in late April 2026 within days of the Q1 crash — while the sellers over the same window were departed insiders, chiefly former chairman Thomas Rutledge.
Source: SEC Form 4 filings, open-market transactions (code P and S), 2025–2026; Rutledge total aggregates three sales on 26–27 May 2026.
The counter-fact sits in the same disclosures. Faced with a performance grant sinking far out of the money, the compensation committee did not hold the line — in December 2025 it renewed Winfrey's contract and raised the guaranteed portion of his pay: base salary from $1.7 million to $2.5 million, target bonus from 250% to 300% of salary, and the annual long-term incentive from $17.0 million to $23.0 million, with a $6.0 million top-up option granted in January 2026 that vests purely on time, not on any stock-price hurdle. So the very feature that made the headline grant look demanding — pay only for a much higher share price — is being diluted by a larger stream of ordinary time-vesting equity as the stock stays low. The reported buying is likewise modest in absolute terms: Winfrey's April purchases were about $1.2 million against a holding of roughly one million shares that is itself mostly vested options, and part of his existing stake is pledged against personal loans. The CEO-to-median-worker pay ratio was 82.4 to 1 for 2024 — unremarkable for the sector, and a reminder that the equity, not the cash, is where alignment is meant to live.
Where the alignment holds, and where it thins
On the evidence, Charter offers a specific and unusual form of alignment: not founder-operators with their net worth in the stock, but two patient, family-controlled strategic holders steering through a stockholders agreement, a chief executive whose largest incentive only pays on a near-quadruple, and directors adding shares after the sell-off. That is a better setup than a widely-held company run for the next print, and it fits a fallen-star thesis where the owners are staying rather than leaving. The reservation is that management's own stake is thin, the board has been willing to soften pay when the performance mechanism bit, and the same concentration that buys patience also locks in whatever capital-allocation preference the incoming Cox–A/N axis brings.
Two things would move this read. If the post-close board, now chaired by Cox, directs the free-cash-flow inflection toward retiring debt at the pace management has promised — up to half a turn of leverage a year — the family control reads as aligned stewardship. If instead the buyback machine simply resumes at scale once the Liberty unwind is complete, the concentration will have entrenched the policy that keeps the equity a thin residual on a $94 billion debt load (Business and Balance Sheet).
The Cox Combination
Charter's pending combination with Cox Communications is the largest single change to the asset an investor is being asked to value. It enlarges the cash-generating base and the debt against it at the same time: about $13 billion of revenue and roughly $5 billion of EBITDA arrive alongside about $12.4 billion of assumed net debt [1] [2]. On the company's own pro forma statements — before any synergies — the deal is dilutive to the earnings that reach a Charter share, because Cox Enterprises is paid largely in partnership units rather than stock. Charter's case for the deal is the synergies and the operating playbook it can apply to a footprint whose revenue is currently shrinking faster than its own.
Cox Enterprise Value
Cox 2025E EBITDA Multiple
Cox Enterprises Stake
Assumed Net Debt
Sources: Cox valued at approximately $34.5 billion enterprise value — $21.9 billion equity plus $12.6 billion net debt — at 6.44x 2025 estimated Adjusted EBITDA, per the May 2025 announcement [3] [4]; Cox Enterprises' 25.1% stake and updated $12.4 billion assumed net debt from the FY2025 10-K and Q1 2026 10-Q [5] [6].
What Charter is buying, and how it is paying
Cox Communications is the longest continuous operator in US cable, contributing a residential business of about 12 million passings and 6 million customers [7], plus its commercial fibre and managed-IT and cloud businesses [8]. Added to Charter's roughly 58 million passings, the combined company would reach over 70 million households [9]. Cox contributes its residential cable business to Charter Holdings — the operating partnership Charter itself sits above — and sells its commercial businesses to Charter, with Cox Enterprises paying $1.00 in the mechanics [10].
The structure of the payment matters more than its headline size. Against a preliminary purchase price of about $18.6 billion, only $4.0 billion is cash. The rest is $7.0 billion of Charter Holdings common units and $7.6 billion of convertible preferred units carrying a $6.0 billion liquidation preference and a 6.875% cash dividend [11].
Source: preliminary purchase price allocation, Cox pro forma financial statements, valuing the common units at the $208.75 close on 31 December 2025 [12]; assumed net debt per the Q1 2026 10-Q [13].
Two features of that mix stand out. First, because most of the consideration is Charter equity, the deal became cheaper as Charter's stock fell: the common units, valued at Charter's $353.64 announcement-date price in May 2025, were marked at the $208.75 December close for the pro forma statements [14] [15]. Second, the $6.0 billion preferred is insulated from that decline and its 6.875% dividend — about $410 million a year — ranks ahead of the common in the cash waterfall, a fixed claim layered on top of the $94 billion debt stack (Business and Balance Sheet).
The combined entity by the numbers
On a full-year FY2024 pro forma basis, the two businesses together generated $68.2 billion of revenue and $15.2 billion of operating income, against Charter's standalone $55.1 billion and $13.1 billion [16]. Adding depreciation and amortisation back, combined EBITDA runs near $27 billion.
Source: unaudited pro forma condensed combined statement of operations, year ended 31 December 2024 [17].
The balance sheet is where the size shows. Combined total debt is about $112 billion, and the pro forma net leverage of roughly 4x is in line with the company's stated approximately 3.9x, calculated on March 2025 balances [18] [19]. The combination does nothing to change the character of the balance sheet that Business and Balance Sheet described: combined franchises and goodwill total roughly $108 billion against controlling-interest book equity of about $14 billion — the value still rests on franchise cash flows, not realisable assets [20].
Why reported earnings per share fall
The pro forma statements show diluted earnings per Charter share falling from $34.97 to $31.18 for FY2024, and from $25.95 to $24.19 for the nine months to September 2025 — a reduction of roughly 11% and 7% [21] [22].
Source: unaudited pro forma condensed combined statements of operations, FY2024 and nine months ended 30 September 2025; standalone figures are Charter historical [23] [24].
The dilution is not the result of issuing many more Charter shares. Weighted-average diluted shares barely move in the pro forma — from 145 million to 145 million for FY2024 [25]. It comes from where the combined earnings land. Because Cox Enterprises is paid in Charter Holdings partnership units, its share of the combined profit is booked as income attributable to noncontrolling interests: that line rises from $770 million to $2,689 million on the FY2024 pro forma, and the residual left for Charter's own shareholders falls from $5,083 million to $4,532 million even as combined net income grows [26]. The same split shows on the balance sheet, where noncontrolling-interest equity rises to $20.4 billion against $14.0 billion of controlling equity [27]. This connects directly to the ownership structure examined in Ownership and Control: the units are exchangeable into Charter stock over time, so the noncontrolling interest converts into Charter shares as those units are exchanged.
The pro forma explicitly excludes synergies [28]. Management now guides to at least $800 million of run-rate operating-expense synergies within three years, raised from $500 million at announcement [29] [30]. Taxed at Charter's rate and split with the noncontrolling holders, $800 million of pre-tax savings is worth roughly $2 to $3 of earnings per Charter share — enough to offset the bulk of the reported FY2024 dilution, though not, on its own, to make the deal accretive before any of the revenue and capital synergies management describes but has not quantified.
The asset is shrinking faster than Charter's own
Charter's own base is contracting slowly — revenue fell about 0.5% in 2025 (The Broadband Base). Cox's is contracting faster. On its standalone statements, Cox revenue fell 4.2% year over year in the nine months to September 2025, and 5.0% in the third quarter alone [31]. Cox held operating income flat only by cutting operating costs 6.8% over the same period [32].
Source: Cox Communications condensed consolidated statements of operations, nine months ended 30 September 2025 [33].
Cox's own accounting bears on the asset's trajectory. Ahead of closing, Cox is recording a non-cash impairment of approximately $5 billion to $6 billion on its franchise intangibles, which it attributes to "updated long-term financial projections that reflect a reduction in estimated future cash flows due to increased competition" and to recent declines in industry market multiples [34]. That is the seller's own accounting write-down of the same broadband franchises Charter is acquiring, made for the same competitive reasons — fixed wireless, fibre overbuild, saturation — documented in Industry Forces. The cost-cutting that holds Cox's margins today is the same lever Charter counts as synergy tomorrow, so some of the guided saving offsets ongoing revenue decline rather than adding to profit.
The operating case, and what would confirm it
Management's argument is not that Cox is growing, but that Charter can make it grow. Cox's mobile and video penetration are low relative to Spectrum's, which management frames as the principal opportunity: introduce Spectrum pricing, packaging and mobile across the Cox footprint, add a field sales force and stores, and lift products per customer — the same migration it ran on Time Warner Cable, Bright House and Bresnan [35]. The Cox network is described as well maintained, with its mid-split upgrade nearly complete, which management says leaves runway to reach DOCSIS 4.0 at lower cost and without haste [36]. The strategic logic is coherent, and it is the same lower-capex, higher-penetration model that underpins the whole thesis (Cash Conversion) — but it is prospective, and it is being applied to a base losing customers today.
The near-term markers a reader can check are concrete:
Deal completion: Charter has received all required federal and state approvals except from the California Public Utilities Commission, and is working toward a summer 2026 close [37]. A break would leave Charter standalone, its balance sheet unchanged; the risk is delay and diverted management attention rather than a large cash breakage cost.
Leverage: management commits to moving to the low end of a 3.5–3.75x target within three years of close, from roughly 4x pro forma, while continuing buybacks [38]. Whether de-levering and repurchases can both proceed depends on the combined free cash flow that the capex decline is meant to release.
The checkable items after close: the realised synergy figure against the $800 million guide; the trajectory of the legacy-Cox subscriber and revenue lines, which management will report separately for several quarters [39]; and combined free cash flow per share after the $410 million preferred dividend.
Industry Forces
Charter operates in a maturing US broadband market where the secular tailwind — households consuming ever more data over a network cable can upgrade cheaply — accrues to the asset's relevance and cost position, not to its subscriber count or price. The count faces a saturated market, a capacity-capped fixed-wireless entrant, and fibre overbuild. The tailwind mostly protects the cash the network throws off and lets capital spending fall; the headwinds decide how many customers stay and what they pay.
The demand curve keeps rising
The clearest tailwind in the industry is consumption. Cable One, a pure residential-broadband cable operator, reports that its average residential data customer used roughly 835 gigabytes a month in the fourth quarter of 2025, up from about 774 gigabytes a year earlier — close to 8% growth — with the share using more than one terabyte a month rising from 27% to 30%, while peak network utilisation stayed at or below 20% [1] [2].
Monthly Data Use (GB, Q4 2025)
YoY Growth
Customers Over 1 TB / Month
Source: Cable One FY2025 10-K [3] and FY2024 10-K [4]; Cable One is a residential-broadband cable operator on the same HFC model.
Rising usage makes the connection less discretionary each year and raises the cost of disconnecting, which supports pricing at the bottom of the range and underwrites the case for upgrading the network. It is a tailwind for the pipe's relevance. It is not, by itself, a tailwind for the number of pipes sold — a household streaming twice as much still buys one connection.
A cheap path to keeping the network current
The second tailwind sits on the cost side, and it is the one that matters most for a leveraged operator. Charter already offers gigabit download speeds across its entire footprint on DOCSIS 3.1 over plant of 750 megahertz or more [5] [6]. Its network-evolution programme expands spectrum to 1.2 gigahertz through a module upgrade in the hub, node and amplifier — using high splits and distributed access architecture to deliver multi-gig speeds on the DOCSIS 3.1 equipment already in the home — before layering DOCSIS 4.0 and 1.8 gigahertz on top [7]. Charter describes this as a "cost-efficient path to increased speeds" [8] and a "clear path to delivering symmetrical and multi-gig" service [9].
Source: Charter FY2025 10-K, Our Network Technology [10]; FY2024 10-K [11].
The structural point is that cable can match fibre's headline speeds by upgrading electronics on an existing plant, largely without trenching a new line to each home. That is why the capital programme which pushed capex toward $11.7 billion is a finite, self-terminating project rather than a permanent fibre-style build — the mechanism behind the falling-capex path set out in Cash Conversion. The tailwind here is that the network stays competitive at a fraction of a rebuild's cost, protecting both the Adjusted EBITDA the debt rests on and the capex line that swings free cash flow.
A market that has stopped growing
Where the tailwinds stop is volume. US residential broadband is close to saturated: the number of connected households barely grows, so an operator's customer count can rise only by taking share or by holding it against those trying to take it. The maturity is visible in the peer numbers — Comcast's residential connectivity revenue was essentially flat in 2024 (a 0.5% decline) [12], and every large cable operator, Charter included, lost residential broadband customers in 2025, as The Broadband Base set out. Growth in this industry is a share contest, not a rising tide.
Two entrants are taking that share. The first is fixed wireless. T-Mobile intends to grow its fixed-wireless base to 15 million customers by 2030 — raised from an earlier 12-million-by-2028 target — and to add three to four million more through fibre, for 18 to 19 million broadband customers by 2030 [13]. The important qualifier is how the product is capacity-limited: T-Mobile runs fixed wireless on a "fallow capacity" model — the spare 5G capacity left after mobile demand is served — and frames the 15-million figure as a self-imposed ceiling, with none of it "an overbuild" and all of it "incremental" [14]. That bounds the threat in a way the cable filings do not: fixed wireless is constrained by its operators' own spectrum math. The scale of that shift — fixed-wireless net additions set against cable's subscriber losses in 2025 — is quantified in The Broadband Base; the industry structure says that pace runs into a defined limit rather than compounding indefinitely. The second entrant is telco fibre overbuilding cable territory, quantified in Charter's own overlap disclosure and also examined in that chapter.
Convergence is the industry's defensive move
The whole cable group has answered the same way: bundle mobile with broadband to lower churn and raise revenue per relationship. Comcast now carries more than nine million wireless lines — above 15% of its residential broadband base — and hands out free lines it calls a "logical and, importantly, a rational competitive approach" [15]. Altice USA grew mobile service revenue 47% year over year and has converged just over 6% of its broadband base [16]. Charter is furthest along the same path, as Mobile Economics sets out.
Source: Comcast Q4 FY2025 call [17]; Altice USA Q1 FY2025 call [18].
Convergence is genuinely two-sided. It is a tailwind for retention and for revenue per account, and cable's MVNO economics make it a cheap product to sell. But it arrives as price competition — free lines, five-year price guarantees, first-year savings pledges of the kind Mobile Economics details for Charter — so the industry is defending volume by spending price. Convergence lifts the numerator, relationships kept, while pressing on the average revenue those relationships pay.
Policy: one subsidy, one overhang, one loss
Three policy facts frame the backdrop. Government subsidy is expanding the addressable footprint: Charter expects to invest over $8 billion in its rural build, offset by more than $2 billion of support awarded through the end of 2025 under the FCC's Rural Digital Opportunity Fund and other grants, with the BEAD and IIJA programmes the forward source [19] [20]. Against that sits a standing regulatory overhang: broadband is currently classified as an "information service," and the FCC has twice moved to regulate it as a common-carrier "telecommunications service," which Charter warns "could adversely affect our business" [21]. And a subsidy already lost: the Affordable Connectivity Program, a monthly discount for low-income households, expired in the second quarter of 2024, which Comcast attributes part of its broadband losses to [22] and which drove Charter's own step-down in 2024 subscribers.
The forces, netted
Sources: Cable One FY2025/FY2024 10-Ks [23]; Charter FY2025 10-K [24] [25]; T-Mobile Q4 FY2025 call [26]; Comcast FY2024 10-K [27].
The split is consistent across every force. The industry's tailwinds — rising data dependence, a cheap upgrade path, targeted subsidy — accrue to the network's relevance and to the cost of keeping it current. The headwinds — saturation, fixed wireless, fibre, convergence-driven price competition, the ACP loss — fall on how many customers cable keeps and what it charges. That division is the industry backdrop for the chapters that turn to Charter itself — an essential network getting cheaper to keep current, set against a subscriber base that is contested rather than growing.
One external check the corpus cannot settle: precise US broadband penetration levels, the total installed fixed-wireless base, and the dollar size of the BEAD allocation would sharpen the saturation and subsidy reads, and the web-research feed was unavailable for this run. The direction of each force is well supported by the filings; the exact magnitudes at the industry level are not.
Scenarios and Watch Items
Charter trades at roughly 4.9 times Adjusted EBITDA and a low-single-digit multiple of the free cash flow management says the ending capital cycle will unlock — a price that embeds continued decline in the broadband base. The chapters before this one supply the pieces; this one reconciles them. The equity is a thin, highly-levered residual on a business whose near-term default risk is low but whose free cash flow is set to swing on three forces at once: a falling capital budget, a slowly repricing debt stack, and a shrinking subscriber base.
What the price implies
At the July 22, 2026 close of $129.22, Charter's listed equity is worth about $15.8 billion — roughly one-seventh of an enterprise value near $111 billion built on $93.8 billion of net debt. That places the whole enterprise at about 4.9 times the $22.7 billion of Adjusted EBITDA the business earned in 2025 [1]. For a capital-intensive, leveraged operator that is a cheap enterprise multiple, but not a distressed one.
Close (22 Jul 2026)
From Sept 2021 Peak
EV / Adj. EBITDA
Net Debt / EBITDA
Sources: share price as reported (market data); enterprise value and EV/EBITDA derived from reported financials, FY2025 10-K Adjusted EBITDA [2] and Q1 2026 net debt [3]; net leverage 4.15x per Q1 2026 call [4].
The gap between the enterprise multiple and the equity is leverage. On the equity alone the stock is far cheaper: management frames it by taking consensus 2026 free cash flow and substituting the lower 2028 capital budget, which at the share price on its April 24, 2026 call implied "a free cash flow multiple of only about 3.8x, and a free cash flow yield of over 25%" [5]. The stock has since fallen from roughly $180 on that call day to $129.22. On reported 2025 free cash flow of $5.0 billion against the roughly $15.8 billion market cap, the equity free cash flow yield is about 32%; it climbs above 35% only on management's normalized free-cash-flow base, which substitutes the lower post-2028 capital budget and, at today's price, implies a multiple closer to 2.5–3 times. Management named the reason such numbers persist: "the perception of negative perpetuity growth implied in our valuation today" [6].
That yield is a leverage artifact, and it cuts both ways. The business earns about 20 cents of EBITDA per dollar of enterprise value against a 5.2% cost of debt [7]; that spread accrues to the thin equity slice and inflates its yield. The same leverage means a 5% move in Adjusted EBITDA — about $1.1 billion — is roughly a third of the equity's value at a constant multiple. The high free cash flow yield and the fragility are the same fact seen from two sides. And the floor beneath it is cash flow, not assets: the balance sheet is dominated by franchises and goodwill against thin book equity, as Financials and Estimates lays out, so this is not a below-NAV asset play with a realizable backstop.
Three paths for free cash flow
Free cash flow was $5.0 billion in 2025 — net cash from operations of $16.1 billion less $11.7 billion of capital expenditure [8]. The direction from here is set by three forces pulling against each other, bridged in detail in Cash Conversion. Capital expenditure falls: management guides 2026 to about $11.4 billion and a run-rate below $8 billion — $7.5 to $8 billion — once the network-evolution and rural programmes conclude by 2028, a reduction it frames as worth "over $28 of free cash flow per share based on today's share count" [9]. Cash interest drifts up as a 5.07% average coupon stack reprices toward the 7%-plus of recent issuance. And a chunk of the capex relief is taxed back: the 2025 free cash flow rose partly on a $669 million cash-tax benefit from restored 100% bonus depreciation, a shield that shrinks as the capital budget itself shrinks [10].
The swing factor across the three is Adjusted EBITDA, which has held in a $21.6–$22.7 billion band while the base shrank. The scenarios below hold management's 2028 capex guidance and let EBITDA and the cash-tax normalization move.
Source: illustrative, derived from management's 2028 capex guidance [11] and 2025 reported EBITDA, cash flow and cash taxes [12]; not a forecast. Equity FCF yield on ~$15.8bn market cap.
Even the bear path, in which the base erodes fast enough to pull EBITDA to $21 billion and cash taxes normalize toward $2 billion, still leaves free cash flow near its 2025 level and an equity yield above 30% — because the capital-budget relief roughly offsets the operating and tax drag. None of these paths assume the base stabilizes: if EBITDA merely holds and capex lands at guidance, free cash flow steps toward $7 billion. The three paths differ less in whether cash is generated than in how durable that cash is, which is the same question the base-decline chapters left open.
Source: illustrative bridge, derived from reported 2025 free cash flow [13] and management's capex run-rate guidance [14]; cash-tax and interest steps are estimates.
The Cox combination reshapes the base but leaves the per-share picture close to where it stands; its mechanics are set out in The Cox Combination. It adds roughly $5 billion of Adjusted EBITDA and at least $800 million of run-rate opex synergies [15], but also about $12.6 billion of assumed net debt [16], a $6.0 billion preferred paying a 6.875% dividend — about $410 million a year — that ranks ahead of the common [17], and enough new partnership units to lift the as-converted share count to about 179 million at close [18]. On Charter's own pre-synergy pro forma, that combination lowers diluted earnings per Charter share from $34.97 to $31.18 for 2024 even as combined net income grows [19]. The added cash flow and the added claims on it roughly cancel per share, so the standalone scenarios above are a fair proxy for the combined equity — with the caveat that Cox's own revenue is shrinking faster, down 4.2% in the first nine months of 2025.
Bull and bear on the same facts
The disagreement is not about the numbers, which the filings settle, but about whether the base decline is cyclical or secular — and whether the falling capital budget is a durable free cash flow engine or a one-time step that operating erosion slowly consumes.
Sources: base trajectory and capex from the FY2025 10-K and 2026 calls [20] [21]; leverage target and outlook from the Q4 2025 call [22]; Cox pro forma from the Q4 2025 8-K [23].
On the calibration a bankruptcy-averse reader cares about most, the evidence points one way in the near term and leaves the long term open. Adjusted EBITDA covers net interest about 4.5 times, 87% of the debt is fixed at a 5.07% average coupon, the near maturity ladder is light — about $1.1 billion due in 2026 — and no covenant is breached [24]. Near-term default risk is low. The risk that concentrates in the equity is different and slower: that free cash flow, levered seven-to-one, erodes faster than the $94 billion of debt comes down, compressing a residual that is already thin. What sits against that bear read is management's own commitment to move target leverage to the low end of a 3.5–3.75x range and to cut it by up to half a turn a year [25] — a plan that, if met, brings the roughly $94 billion of debt down materially over the next several years.
What to watch
The scenarios turn on a small number of line items that report on a fixed calendar. Each is falsifiable against a named disclosure.
Sources: line items and thresholds from the FY2025 10-K, the Q4 2025 and Q1 2026 earnings calls [26] [27], and the Cox disclosures [28].
The base is where the surprise risk runs. Charter has missed consensus earnings in four of its last six quarters, and the market reactions have been large: the stock fell about a quarter on the April 24, 2026 print, which missed by 9%. With sell-side ratings split (0 strong-buy, 5 buy, 11 hold, 5 sell/strong-sell) and a mean target of $209.94 against the $129.22 close, the external consensus is unusually wide, which is what a genuinely two-sided setup looks like. A reader who owns this equity is underwriting the base at management's word until the internet net-add line proves it either way; the falling capital budget buys the time for that proof, and the leverage sets the penalty if it does not arrive.